Products
SentimenTrader Trading Tools
‍
Backtest Engine
My Trading Toolkit
Correlation Analysis
Seasonality
Market Prediction
Indicators & Data API
‍
Proprietary Indicators & Charts
Market Data API
Strategies & Scanner
‍
50+ Trading Strategies
Smart Stock Scanner
Smart Option Scanner
Research Reports
‍
Research Solutions
Reports Library
Free Resources
Simple Backtest Calculator
Simple Seasonality Calculator
The Kelly Criterion Calculator
Sentiment Geo Map
Public Research Reports
Education
Sentiment Indicators
Technical Indicators
Pricing
Company
About
In the News
Testimonials
Client Success Stories
Contact
Log inLoginSign up
< BACK TO ALL REPORTS

A word of warning on soybeans

Jay Kaeppel
2025-07-14
Seasonality is "climate, not weather." That said, when it comes to the soybean market, there are times when it's just not worth fighting the calendar. You are there. Details herein.

Key points

  • Soybeans have shown themselves to be one of the most consistently cyclical commodity markets
  • Due to the planting cycle in the U.S., the risk to the current year's crop is typically well known by mid-July
  • As the risk premium comes out of the market, the price tends to fall

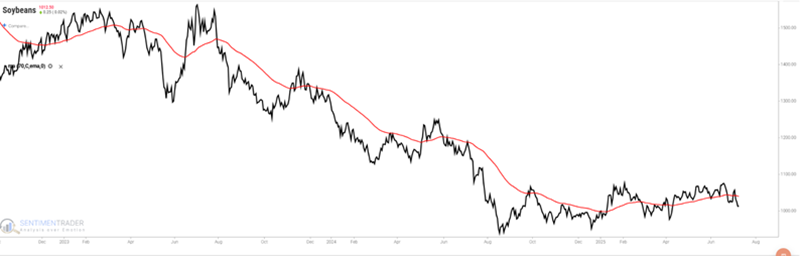
Following a plunge and a weak rebound, soybean prices have resumed a price downtrend

Soybean prices have declined by over 20% in the last year. After plunging sharply for over a year, the price bottomed in December 2024 and staged a weak rebound. Price recently dipped below its 70-day exponential moving average and is in a downtrend.

Because soybeans are a highly cyclical market, some pundits expect the next big price move to be up. Perhaps they will ultimately be proven correct. Nevertheless, history strongly suggests that caution (and a willingness to play the short side instead) is in order. Let's examine this history more closely.

Beans are just now entering a period of typical seasonal weakness

The Annual Seasonal Trend chart for soybeans reveals that July, August, and September are typically the weakest months of the year for beans.


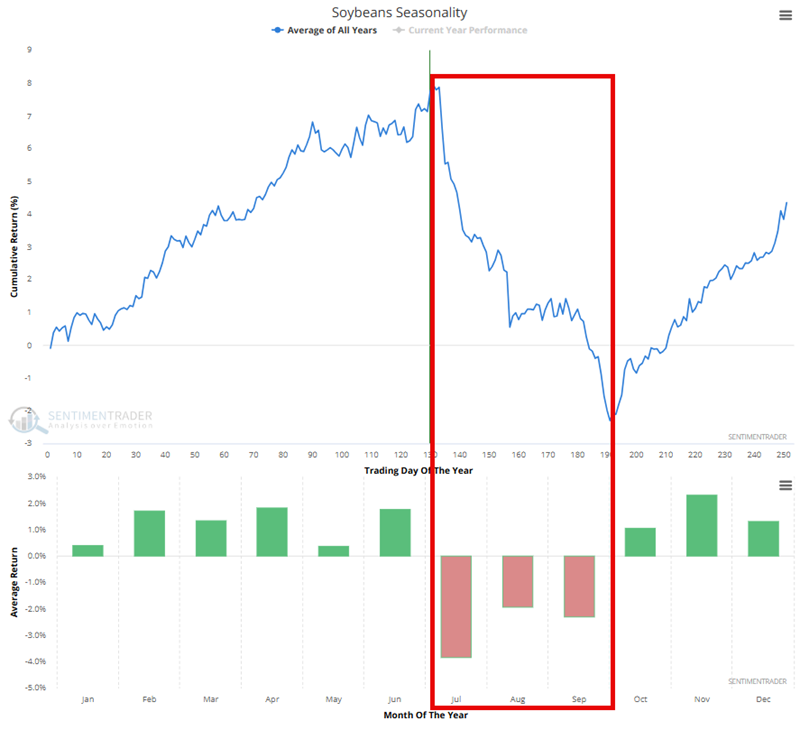
Specifically, the weakest seasonal time of year for beans extends from the close on Trading Day of the Year (TDY) #131 through the close of TDY #191. For 2024, this period extends from the close on 2025-07-14 through 2025-10-07.

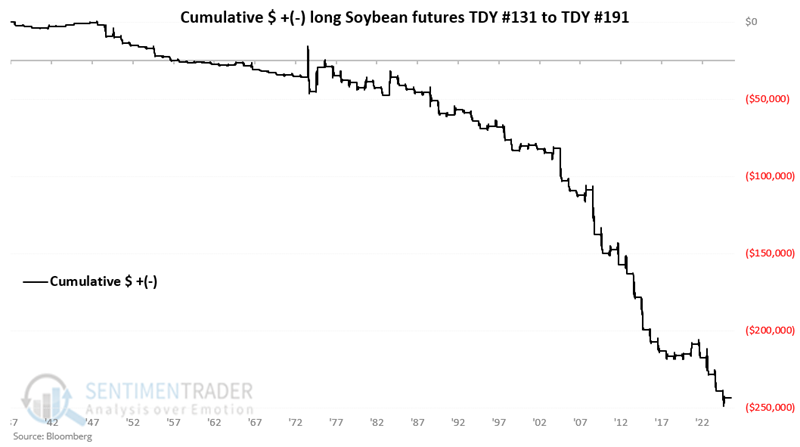
The chart below displays the hypothetical dollar +(-) from holding long one soybean futures contract only during this period every year since 1937. Notice anything?


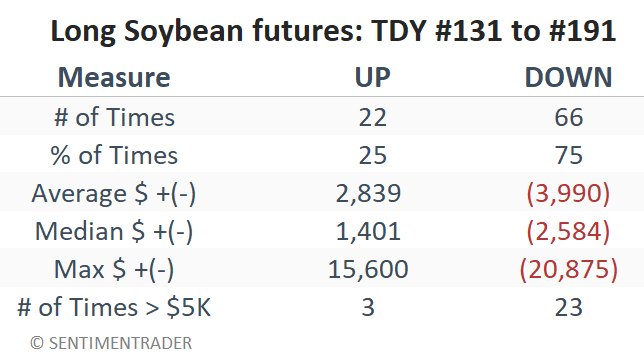
The table below summarizes soybean performance during this period.

What the research tells us…

As always in the markets, anything is possible. A 25% Win Rate tells us that historically, there is a one-in-four chance that soybeans will show a gain in the next roughly three months. It is also fair to note that during this "bearish" seasonal period, beans gained over $15K in 1974, over $11K in 1983, and over $6K in 202. So there are no guarantees. That said, while those three years saw gains of over $5K, 23 years saw a loss of over $5K for soybeans between TDY #131 and #191. That combined with a 75% loss rate, higher average and median declines, and the fact that price and seasonality are presently in agreement, argues strongly for traders to favor the short side of the soybean market.

In theory, soybeans should continue to decline in price. In reality, each trader must decide when to enter the market on the short side, how much capital they are willing to risk, and where to place a stop-loss order. Remember, setups and indicators - no matter how promising they appear - never relieve you of your responsibility to manage your trades and the capital in your account.

PRODUCTS
SentimenTrader
Trading Tools
Indicators & Data API
‍
Strategies & Scanner
‍
Research Reports
FREE
RESOUrCES
Simple Backtest
Calculator
Simple Seasonality
Calculator
The Kelly Criterion
Calculator
Sentiment Geo Map
‍
Public Research Reports
‍
Education
Sentiment Indicators
‍
Technical Indicators
‍
Pricing
Bundle pricing
‍
FAQ
‍
Announcements
‍
COMPANY
‍
About
‍
In the News
‍
Testimonials
‍
Client Success Stories
CONTACT
‍
General Inquiries
‍
Media Inquiries
‍
Financial Professionals Inquiries
‍
© 2026 Sundial Capital Research Inc. All rights reserved.
Setsail Marketing
TermsPrivacyAffiliate Program
Risk Disclosure: The information and tools provided are for research and analytical purposes only and are not intended as investment advice. Market analysis involves uncertainty, and outcomes may differ from expectations. Users should conduct their own due diligence and consider their individual circumstances before making any financial decisions. Past performance is not necessarily indicative of future results.

Hypothetical Performance Disclosure: Hypothetical performance results have many inherent limitations, some of which are described below. No representation is being made that any account will or is likely to achieve profits or losses similar to those shown; in fact, there are frequently sharp differences between hypothetical performance results and the actual results subsequently achieved by any particular trading program. One of the limitations of hypothetical performance results is that they are generally prepared with the benefit of hindsight. In addition, hypothetical trading does not involve financial risk, and no hypothetical trading record can completely account for the impact of financial risk of actual trading. for example, the ability to withstand losses or to adhere to a particular trading program in spite of trading losses are material points which can also adversely affect actual trading results. There are numerous other factors related to the markets in general or to the implementation of any specific trading program which cannot be fully accounted for in the preparation of hypothetical performance results and all which can adversely affect trading results.

Testimonial Disclosure: Testimonials appearing on this website may not be representative of other clients or customers and is not a guarantee of future performance or success.