Products
SentimenTrader Trading Tools
‍
Backtest Engine
My Trading Toolkit
Correlation Analysis
Seasonality
Market Prediction
Indicators & Data API
‍
Proprietary Indicators & Charts
Market Data API
Strategies & Scanner
‍
50+ Trading Strategies
Smart Stock Scanner
Smart Option Scanner
Research Reports
‍
Research Solutions
Reports Library
Free Resources
Simple Backtest Calculator
Simple Seasonality Calculator
The Kelly Criterion Calculator
Sentiment Geo Map
Public Research Reports
Education
Sentiment Indicators
Technical Indicators
Pricing
Company
About
In the News
Testimonials
Client Success Stories
Contact
Log inLoginSign up
< BACK TO ALL REPORTS

A warning sign returns as macro deteriorates

Jay Kaeppel
2022-06-09
The combination of a high Bear Market Probability index and a plunging Macro Index Model has caused a yellow (bordering on red) flag to pop up again for investors. While no one indicator or factor should ever guide one's investments, this latest development should trigger the "Hope for the best, prepare for the worst" reaction for investors.

Key Points

  • The Goldman Sachs Bear Market Probability Index remains ensconced in unfavorable territory
  • Our Macro Index Model fell on June 1st into unfavorable territory
  • This confluence of factors has triggered another potential warning sign for stocks

Indicator #1: Bear Market Probability

The Bear Market Probability indicator is calculated by Goldman Sachs using five fundamental inputs - the U.S. Unemployment Rate, ISM Manufacturing Index, Yield Curve, Inflation Rate, and P/E Ratio. Each month's reading is ranked versus all other historical readings and assigned a score. In theory, the higher the score, the higher the probability of a bear market in the months ahead. 

The chart below displays those months when this indicator stood at 0.72 or higher. The readings occurred in 1972, 1999-2000, 2005-2006, 2017-2018, and 2021. 

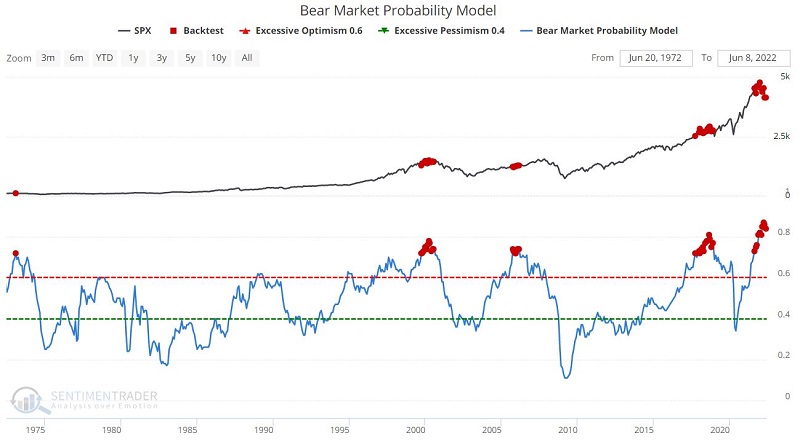
Sometimes, these readings were very timely; in others, they were a bit early. The results might be disappointing if one relies on this model as a precision timing tool. However, if one includes this indicator as part of a "weight of the evidence" approach, the signals can help keep you alert to potential impending dangers.

Indicator #2: Macro Index Model

Our composite economic model - the Macro Index Model - is favorable for stocks and the overall economy when it is above 0.70 and unfavorable when it is below 0.70. For a more detailed discussion of this indicator, see this article. See Dean's article for an in-depth look at the implications of this latest decline.

The chart and table below display the Macro Index Model below 0.70.

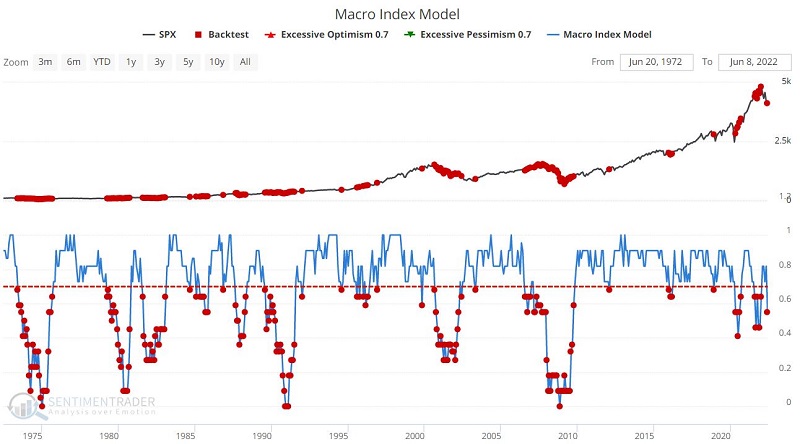
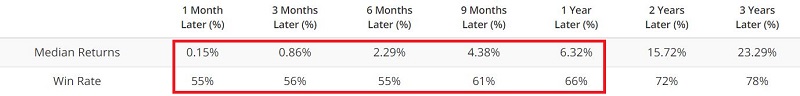
As you can see, stock market performance is typically subdued when the state of the economy is in question.

Bear Market Probability - Macro Index Model

Jason first introduced the combination of these two valuable indicators in this September 2021 article. The chart below displays the net result when the value for the Macro Index Model is subtracted from the Bear Market Probability indicator. It also highlights when the value crossed above 29 for the first time in six months.

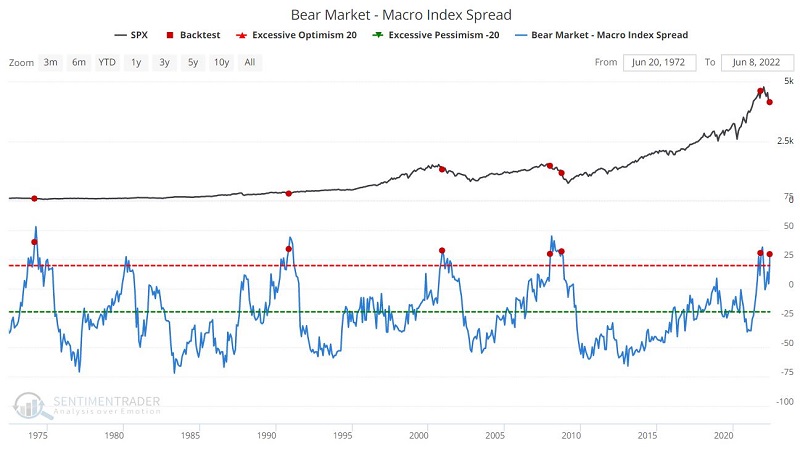
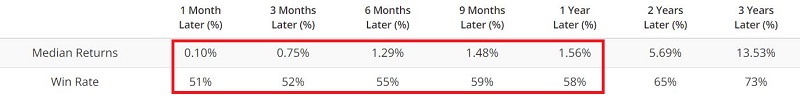
The table below displays a summary of S&P 500 performance following previous signals.

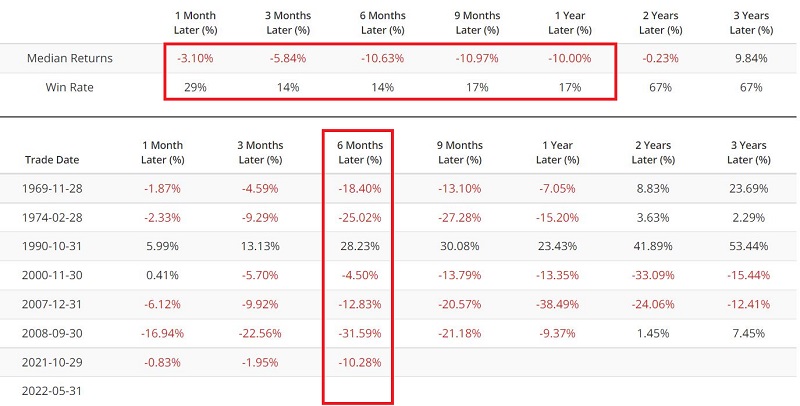
Results during the six months following a signal have been particularly subpar. The exception was 1990, which showed no ill effects as the economy recovered quickly and the stock market soared. But all other readings - including the 10/29/2021 signal - witnessed significant market weakness over the next 12 months.

For an alternative trading approach using slightly different rules, see this article.

What the research tells us…

On June 1st, the Macro Index Model plunged from 0.818 to 0.545, which pushed the Bear Market Probability - Macro Index Model indicator back above 0.29 for the first time in over six months, thus prompting a new warning signal. Will the year ahead follow the 1990 model and shrug off this unfavorable reading? Or will it follow more in line with the other previous signals? The reality is that there is no way to predict with any certainty. But at the very least, this latest reading suggests that investors "Hope for the best, but prepare for the worst."

PRODUCTS
SentimenTrader
Trading Tools
Indicators & Data API
‍
Strategies & Scanner
‍
Research Reports
FREE
RESOUrCES
Simple Backtest
Calculator
Simple Seasonality
Calculator
The Kelly Criterion
Calculator
Sentiment Geo Map
‍
Public Research Reports
‍
Education
Sentiment Indicators
‍
Technical Indicators
‍
Pricing
Bundle pricing
‍
FAQ
‍
Announcements
‍
COMPANY
‍
About
‍
In the News
‍
Testimonials
‍
Client Success Stories
CONTACT
‍
General Inquiries
‍
Media Inquiries
‍
Financial Professionals Inquiries
‍
© 2026 Sundial Capital Research Inc. All rights reserved.
Setsail Marketing
TermsPrivacyAffiliate Program
Risk Disclosure: The information and tools provided are for research and analytical purposes only and are not intended as investment advice. Market analysis involves uncertainty, and outcomes may differ from expectations. Users should conduct their own due diligence and consider their individual circumstances before making any financial decisions. Past performance is not necessarily indicative of future results.

Hypothetical Performance Disclosure: Hypothetical performance results have many inherent limitations, some of which are described below. No representation is being made that any account will or is likely to achieve profits or losses similar to those shown; in fact, there are frequently sharp differences between hypothetical performance results and the actual results subsequently achieved by any particular trading program. One of the limitations of hypothetical performance results is that they are generally prepared with the benefit of hindsight. In addition, hypothetical trading does not involve financial risk, and no hypothetical trading record can completely account for the impact of financial risk of actual trading. for example, the ability to withstand losses or to adhere to a particular trading program in spite of trading losses are material points which can also adversely affect actual trading results. There are numerous other factors related to the markets in general or to the implementation of any specific trading program which cannot be fully accounted for in the preparation of hypothetical performance results and all which can adversely affect trading results.

Testimonial Disclosure: Testimonials appearing on this website may not be representative of other clients or customers and is not a guarantee of future performance or success.