
A warning sign from high-yield bonds

Key points
- High-yield bonds are much more highly correlated to stocks than they are to treasury bonds
- Historically, they have served as a useful bellwether for the stock market
- A recent signal qualifies as "unfavorable" for stocks - but serves as more of a warning than as a "hair on fire sell signal"
The High Yield Golden Cross strategy
Our High-Yield Gold Cross strategy is available on our Tools | Strategies page. It is one of my favorites for two reasons: 1) Its simplicity and 2) its history of avoiding some significant market declines.
The gist of the model is very straightforward:
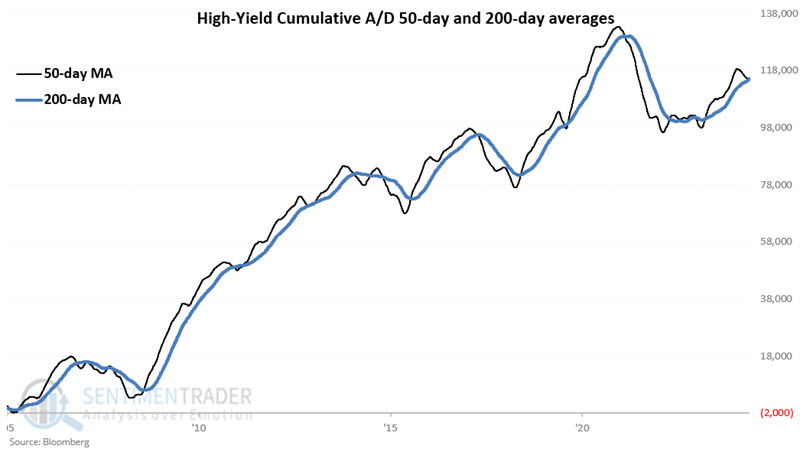
- The model is considered favorable for stocks when the 50-day average of the High-Yield Bond Cumulative A/D Line is above the 200-day average
- Conversely, the model is deemed unfavorable to stocks when the 50-day average drops below the 200-day average
My fondness for this model aside, it by no means amounts to "precision market timing." Roughly half of the historic "sell" signals (i.e., the 50-day average dropping below the 200-day average) have been followed by a higher price for the S&P 500 by the time of the subsequent "buy" signal (i.e., the 50-day subsequently moved back above the 200-day average).
Let's take a closer look.
The High-Yield Golden Cross Strategy
The chart below displays the 50-day and 200-day moving average for the High-Yield Bond Cumulative A/D Line.
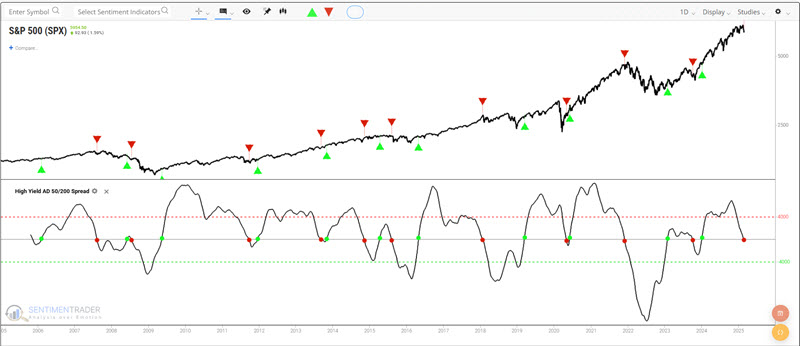
The High Yield Golden Cross strategy treats these crossovers as buy and sell signals, as shown in the chart below. The most recent sell signal occurred during the week ending 2025-02-28.
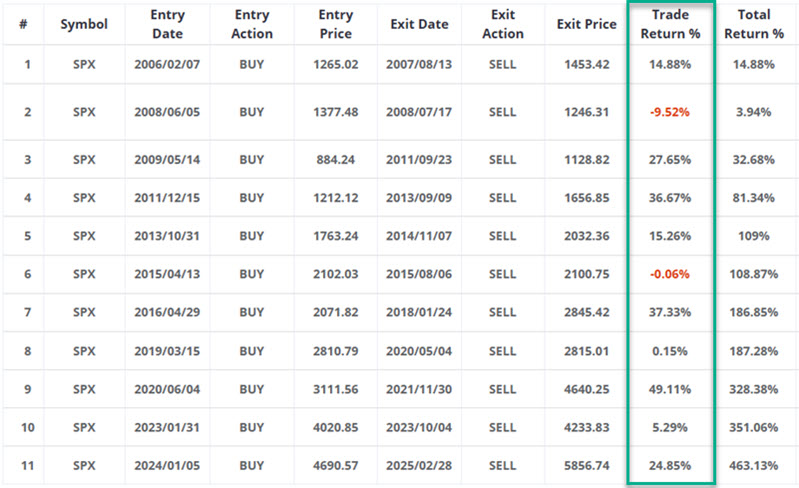
The table below displays the performance of the S&P 500 Index during buy signals.
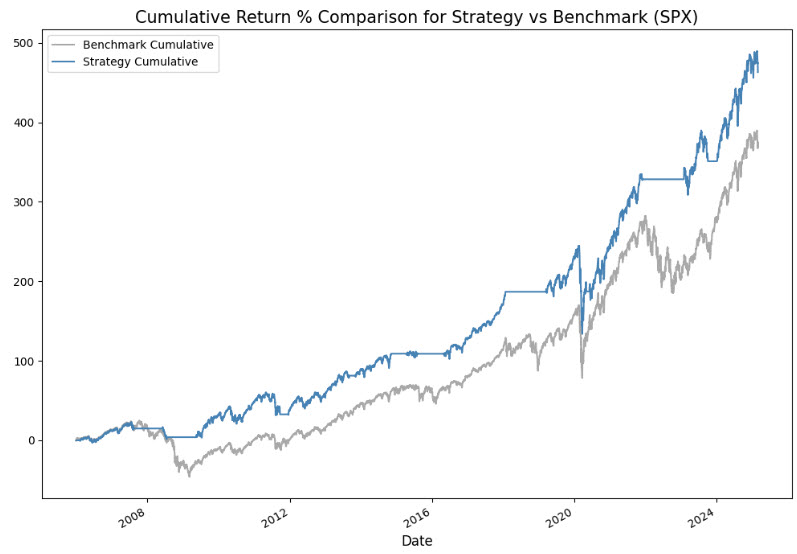
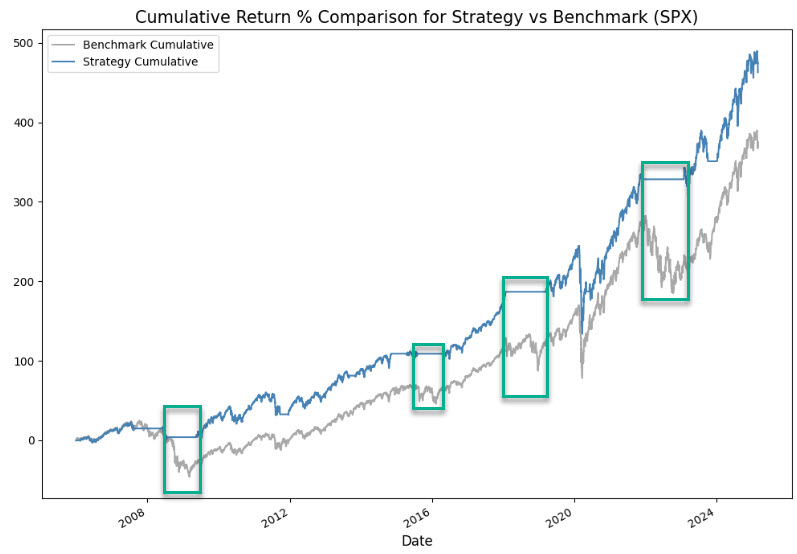
The blue line below displays the hypothetical equity curve achieved by holding the S&P 500 Index only during the buy signals. The grey line shows the buy-and-hold equity curve.
The boxes in the chart below highlight several periods when acting on a sell signal from the High-Yield Golden Cross strategy would have allowed an investor to sidestep a meaningful market decline.
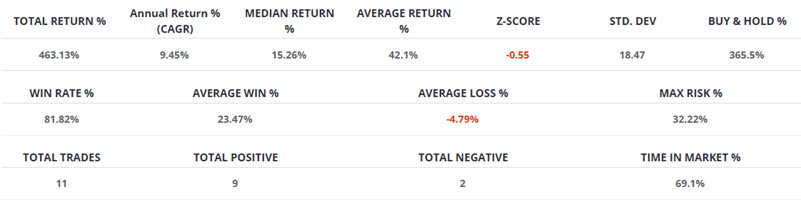
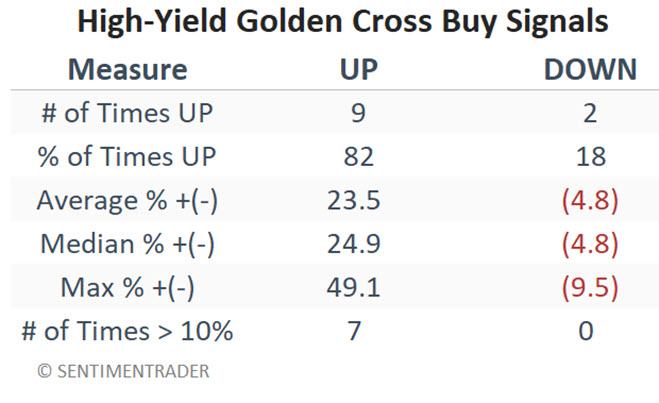
The tables below summarize S&P 500 performance during buy signal periods for the High-Yield Golden Cross Strategy.
A closer look at sell signal periods
A sell signal occurred during the week ending 2025-02-28. Does this mean that stocks are doomed to decline from here? Not necessarily. The primary implication is that a useful "weight of the evidence" piece of the puzzle has fallen into an unfavorable state.
If we look again at the buy and sell signals in the chart below, we can see lengthy and significant market declines followed by some down red arrows. In contrast, others were followed rather quickly by a new up-green arrow (signifying a new buy signal). The reality is that there is no way to predict how long the new sell signal will remain in force, nor what exactly the stock market will do between now and the next buy signal.

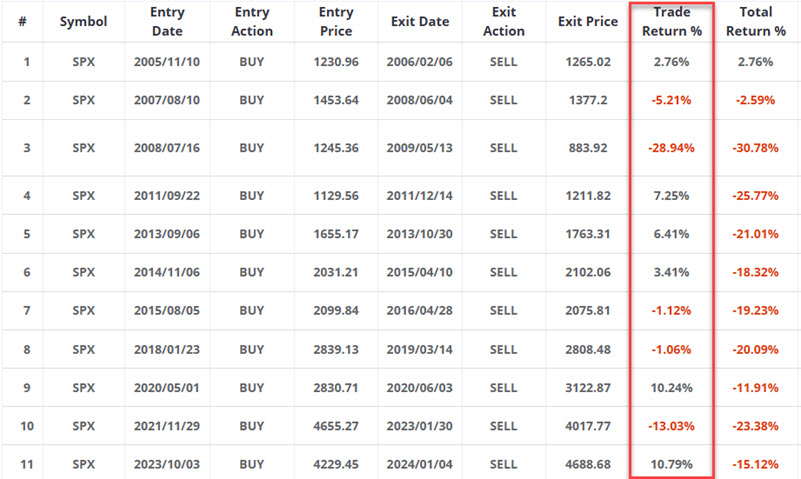
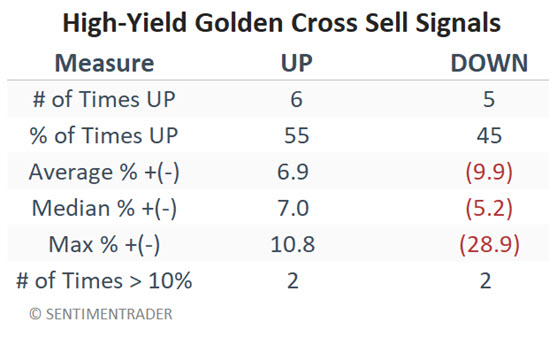
The table below displays the performance of the S&P 500 during each of the previous sell signals. Again, we can note some signals that avoided significant declines, while others involved buying back at a higher price. "Whipsaws" are a common fact of life when employing any trend-following indicator. Still, the net result was that the S&P 500 has declined -15.12% during High-Yield Golden Cross Strategy sell signals over the past 20 years.
The chart below displays the hypothetical equity curve if one had held the S&P 500 index only during the sell signal periods to better visualize the nature of market performance.
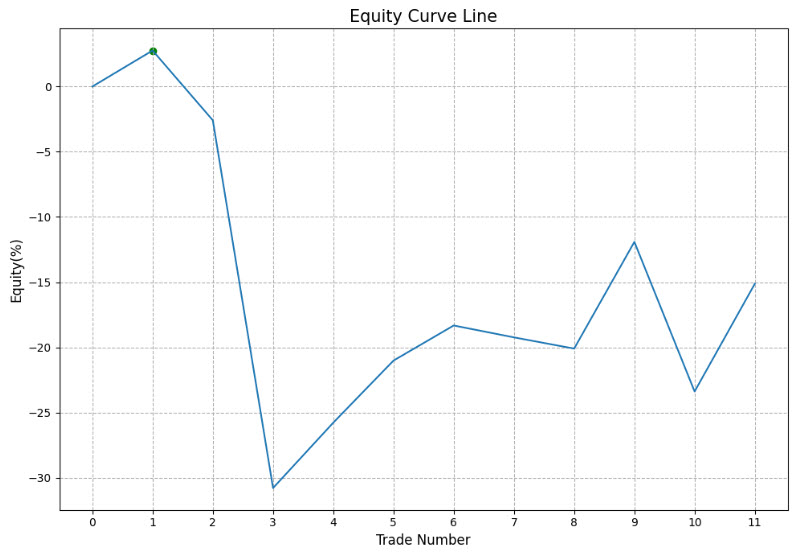
The table below summarizes S&P 500 performance during High Yield Golden Cross sell signals.
What the research tells us…
So, will the latest sell signal from the High Yield Gold Cross strategy be reversed quickly with the S&P 500 at a higher price? Or are we headed for a significant stock market decline? The history of this strategy suggests that there is no way to predict in advance which sell signals will result in market losses and which won't. So the proper response to the recent sell signal is probably not to panic and "sell everything" but rather to stand forewarned that a meaningful pillar in the bullish case (the strategy had been favorable since October of 2023) has fallen and that stock market gains could get a bit more challenging in the months ahead.