Products
SentimenTrader Trading Tools
‍
Backtest Engine
My Trading Toolkit
Correlation Analysis
Seasonality
Market Prediction
Indicators & Data API
‍
Proprietary Indicators & Charts
Market Data API
Strategies & Scanner
‍
50+ Trading Strategies
Smart Stock Scanner
Smart Option Scanner
Research Reports
‍
Research Solutions
Reports Library
Free Resources
Simple Backtest Calculator
Simple Seasonality Calculator
The Kelly Criterion Calculator
Sentiment Geo Map
Public Research Reports
Education
Sentiment Indicators
Technical Indicators
Pricing
Company
About
In the News
Testimonials
Client Success Stories
Contact
Log inLoginSign up
< BACK TO ALL REPORTS

A volume ratio pattern triggered a new buy signal

Dean Christians
2022-09-13
A two-day NYSE up-down volume ratio pattern showed overwhelming volume flowing into advancing issues relative to declining issues. The bullish skew triggered a new buy signal from a TCTM Composite Thrust Model voting member.

Key points:

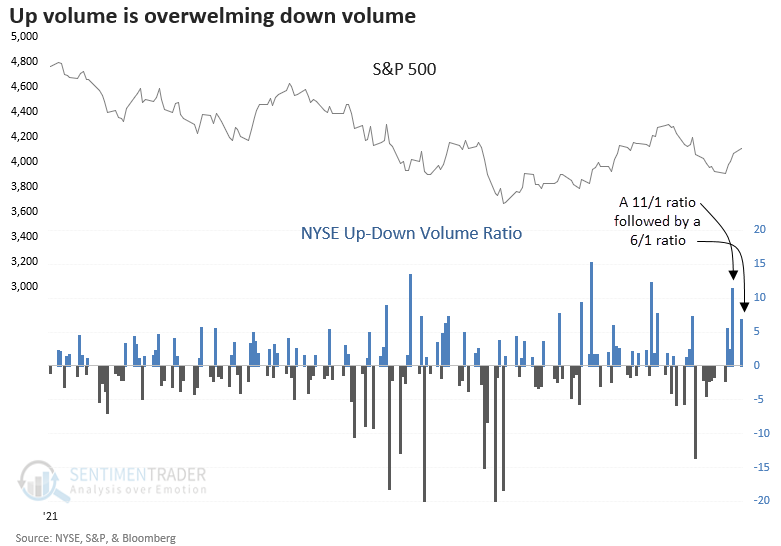
  • On Monday, the ratio between NYSE up and down volume exceeded 6/1 
  • The bullish volume skew followed a ratio of 11/1 in the previous session
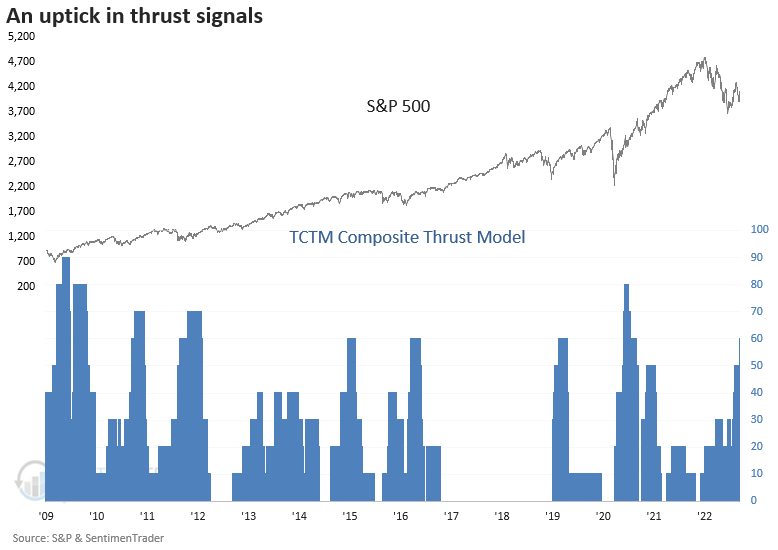
  • The volume pattern triggered a signal from a TCTM Composite Thrust Model member
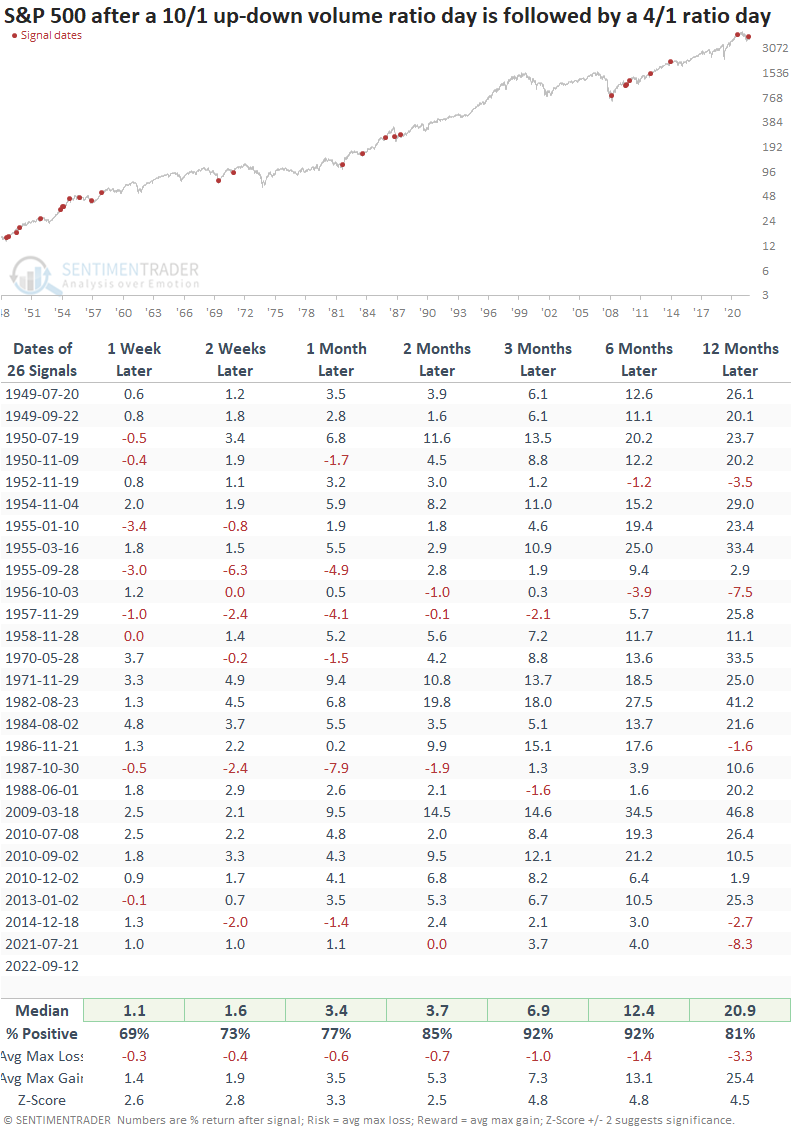
  • After other signals, the S&P 500 rallied 92% of the time over the next six months

A short-duration volume pattern suggests demand for stocks

The bullish breadth and volume trends that started last week continued on Monday, with the NYSE up-down volume ratio exceeding 6/1. The bullish skew in volume followed an even more impressive ratio of 11/1 in the previous session.  

The two-day volume ratio pattern of > 10/1 and > 4/1 triggered a buy signal from a TCTM Composite Thrust Model member.

If today's selling pressure persists, then we'll have to reassess and see if it negates any of the positive implications of the positive thrusts.

Similar signals preceded gains 92% of the time

The volume ratio pattern generated 26 other signals since 1949. Returns, win rates, and z-scores were excellent across all time frames. Once the market moves past the first month, drawdowns were remarkedly benign over the next two to six months, with a worst-case return of -3.9%.

A short-term trend reversal thrust signal

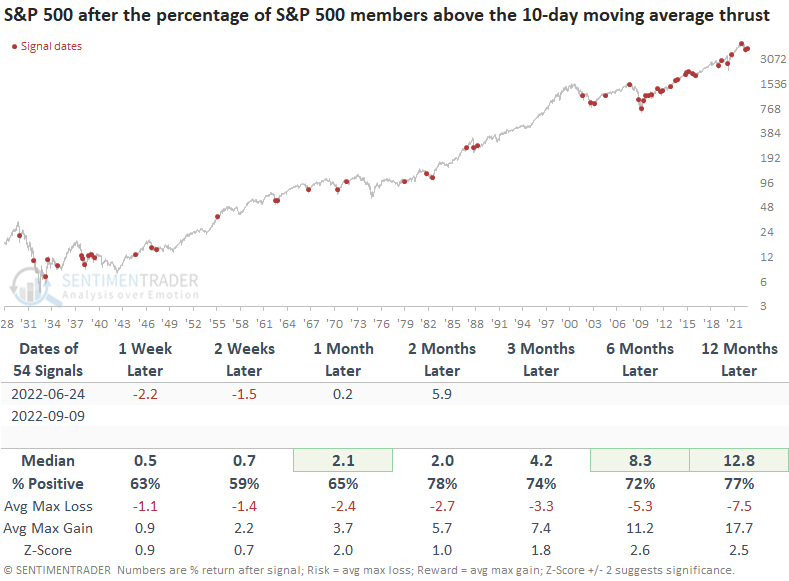
Last Friday, an additional TCTM Composite Thrust Model member triggered a buy signal when the number of S&P 500 members trading above the 10-day moving average reversed from < 7% to > 90% in three sessions. Jason highlighted a similar pattern in his note on Monday.

The previous signal from June got off to a rough start but has since recovered nicely. 

Tactical Composite Trend Model (TCTM)

The Composite Thrust Model (CTM) signal count increased to 60% with the new volume ratio signal. If you recall, the CTM issued a buy signal in August when the count increased to 50%.  

What the research tells us...

When the ratio between NYSE up and down volume exceeds 10/1 and 4/1 in successive sessions, the surge in up volume relative to down volume suggests demand from buyers that typically leads to further positive momentum. Similar setups to what we're seeing now have preceded excellent returns, win rates, and z-scores across all time frames. As a proponent of a weight-of-the-evidence approach, it's encouraging to see the 10-day average thrust signal trigger in conjunction with the volume ratio alert.

PRODUCTS
SentimenTrader
Trading Tools
Indicators & Data API
‍
Strategies & Scanner
‍
Research Reports
FREE
RESOUrCES
Simple Backtest
Calculator
Simple Seasonality
Calculator
The Kelly Criterion
Calculator
Sentiment Geo Map
‍
Public Research Reports
‍
Education
Sentiment Indicators
‍
Technical Indicators
‍
Pricing
Bundle pricing
‍
FAQ
‍
Announcements
‍
COMPANY
‍
About
‍
In the News
‍
Testimonials
‍
Client Success Stories
CONTACT
‍
General Inquiries
‍
Media Inquiries
‍
Financial Professionals Inquiries
‍
© 2026 Sundial Capital Research Inc. All rights reserved.
Setsail Marketing
TermsPrivacyAffiliate Program
Risk Disclosure: The information and tools provided are for research and analytical purposes only and are not intended as investment advice. Market analysis involves uncertainty, and outcomes may differ from expectations. Users should conduct their own due diligence and consider their individual circumstances before making any financial decisions. Past performance is not necessarily indicative of future results.

Hypothetical Performance Disclosure: Hypothetical performance results have many inherent limitations, some of which are described below. No representation is being made that any account will or is likely to achieve profits or losses similar to those shown; in fact, there are frequently sharp differences between hypothetical performance results and the actual results subsequently achieved by any particular trading program. One of the limitations of hypothetical performance results is that they are generally prepared with the benefit of hindsight. In addition, hypothetical trading does not involve financial risk, and no hypothetical trading record can completely account for the impact of financial risk of actual trading. for example, the ability to withstand losses or to adhere to a particular trading program in spite of trading losses are material points which can also adversely affect actual trading results. There are numerous other factors related to the markets in general or to the implementation of any specific trading program which cannot be fully accounted for in the preparation of hypothetical performance results and all which can adversely affect trading results.

Testimonial Disclosure: Testimonials appearing on this website may not be representative of other clients or customers and is not a guarantee of future performance or success.