Products
SentimenTrader Trading Tools
‍
Backtest Engine
My Trading Toolkit
Correlation Analysis
Seasonality
Indicators & Data API
‍
Proprietary Indicators & Charts
Market Data API
Strategies & Scanner
‍
50+ Trading Strategies
Smart Stock Scanner
Research Reports
‍
Research Solutions
Reports Library
Free Resources
Simple Backtest Calculator
Simple Seasonality Calculator
The Kelly Criterion Calculator
Sentiment Geo Map
Public Research Reports
Pricing
Company
About
In the News
Testimonials
Client Success Stories
Contact
Log inLoginSign up
< BACK TO ALL REPORTS

A very expensive earnings season

Jason Goepfert
2021-04-14
As we head into Q1 earnings season, valuations are historically high and Wall Street has high expectations.

As we head into Q1 earnings reporting season, expectations are high and stocks are expensive. Wall Street, and the investors that rely on their analysis, are gearing up for blockbuster performances.

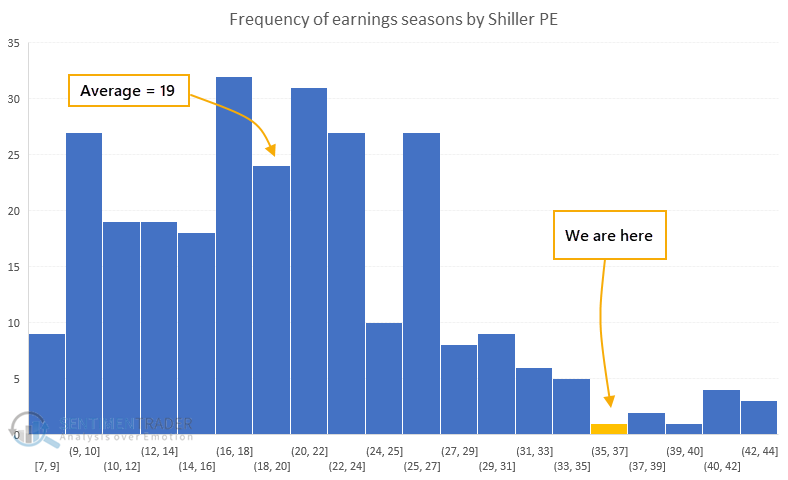
At the start of the last 282 earnings seasons, dating back to 1950, the average Shiller PE ratio for the S&P 500 was 19.3. This season, its valuation is nearly twice that, above 37.0.

The histogram below shows the distribution of valuation ratios on days when earnings season began for any quarter since 1950.

Shiller PE at start of earnings season

It's not a shocker that stocks are expensive, just as we head into the period that investors will be most focused on the denominator of that equation. But using valuation for short-term guidance like a single earnings season is iffy, and indeed there has been only a slight negative correlation.

There have been 16 Q1 earnings seasons when the Shiller PE was 25 or higher, and the S&P's returns during those earnings seasons was well below the average return during other seasons.

Stat Box

For only the 12th time since 1928, the S&P 500 rose more than 0.25% on Tuesday to close at a 52-week high, yet there were at least 50 more declining stocks than advancing stocks in the index, as the biggest companies drove the index higher.


What else we're looking at

  • Full returns during Q1 earnings reporting season when CAPE is above 25
  • Difference in returns during earnings season depending on starting valuation
  • An update to our seasonality charts
  • What the advance/decline line is suggesting about risk right now
PRODUCTS
SentimenTrader
Trading Tools
Indicators & Data API
‍
Strategies & Scanner
‍
Research Reports
FREE
RESOUrCES
Simple Backtest
Calculator
Simple Seasonality
Calculator
The Kelly Criterion
Calculator
Sentiment Geo Map
‍
Public Research Reports
‍
Pricing
Bundle pricing
‍
Announcements
‍
FAQ
COMPANY
‍
About
‍
In the News
‍
Testimonials
‍
Client Success Stories
CONTACT
‍
General Inquiries
‍
Media Inquiries
‍
Financial Professionals Inquiries
‍
© 2025 Sundial Capital Research Inc. All rights reserved.
Setsail Marketing
TermsPrivacyAffiliate Program
Risk Disclosure: Futures and forex trading contains substantial risk and is not for every investor. An investor could potentially lose all or more than the initial investment. Risk capital is money that can be lost without jeopardizing ones’ financial security or life style. Only risk capital should be used for trading and only those with sufficient risk capital should consider trading. Past performance is not necessarily indicative of future results.

Hypothetical Performance Disclosure: Hypothetical performance results have many inherent limitations, some of which are described below. No representation is being made that any account will or is likely to achieve profits or losses similar to those shown; in fact, there are frequently sharp differences between hypothetical performance results and the actual results subsequently achieved by any particular trading program. One of the limitations of hypothetical performance results is that they are generally prepared with the benefit of hindsight. In addition, hypothetical trading does not involve financial risk, and no hypothetical trading record can completely account for the impact of financial risk of actual trading. for example, the ability to withstand losses or to adhere to a particular trading program in spite of trading losses are material points which can also adversely affect actual trading results. There are numerous other factors related to the markets in general or to the implementation of any specific trading program which cannot be fully accounted for in the preparation of hypothetical performance results and all which can adversely affect trading results.

Testimonial Disclosure: Testimonials appearing on this website may not be representative of other clients or customers and is not a guarantee of future performance or success.