
A useful, but little-known economic indicator is still flashing green

Key points
- The Real-Time Sahm Rule Recession Indication (SAHM) attempts to identify economic recessions on an impending or concurrent basis
- While not intended to be used as a standalone model, this indicator is presently suggesting a low likelihood of an imminent recession
The Real-Time Sahm Rule Recession Indication (SAHM)
The chart below displays the Real-Time Sahm Rule Recession Indicator (SAHM) at this link. The latest reading of 0.07 for June 2023 was reported on July 7th.
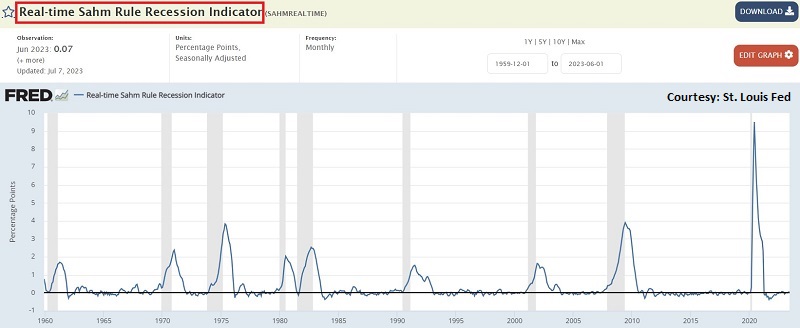
The Sahm Rule is published by The St. Louis Federal Reserve Bank's Federal Reserve Economic Data (FRED) system. The best use of SAHM is as a weight of the evidence indicator and not as a standalone trading or economic model.
The originally stated recession rule is defined as:
Sahm Recession Indicator signals the start of a recession when the three-month moving average of the national unemployment rate (U3) rises by 0.50 percentage points or more relative to its low during the previous 12 months.
Our analysis shows a cutoff level of 0.30 is a simple and valuable alternative. The chart below displays the same indicator values as the chart above, with the 0.30 level overlaid as a horizontal line.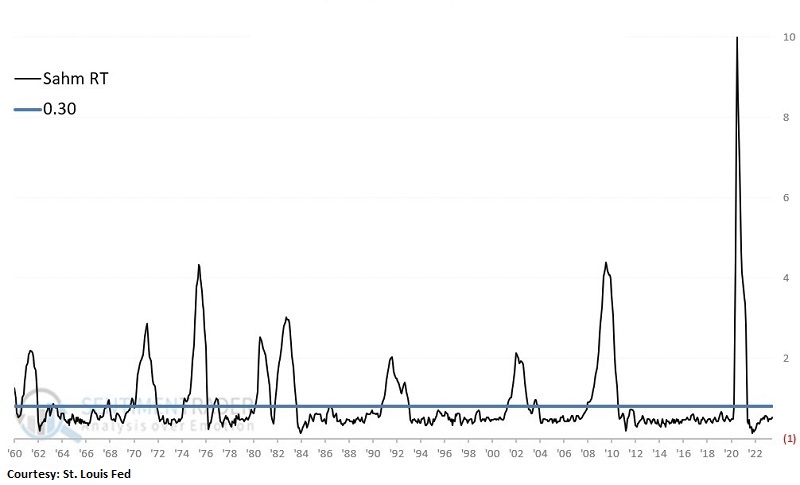
NOTE: using a single set cutoff value is one reason this indicator is best used as weight of the evidence. It is possible in the future that a "miss will be as good as a mile." With this caveat in mind, let's look at the potential economic implications based on fluctuations in this indicator.
Tracking the economy with SAHM
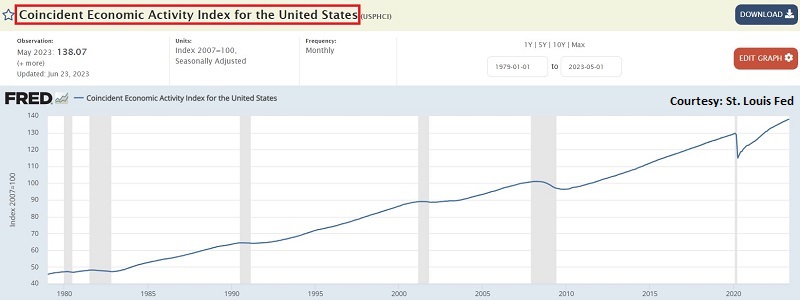
For tracking the state of the economy, we will use the Coincident Economic Activity Index (CEI) for the United States. The data can be found at this link. Note that monthly index values are published with a 1-month lag (ex., the May 2023 value was reported on 2023-06-23). I evaluate this data series only at the end of the month using the latest values.
The chart below (courtesy of FRED) shows the monthly data series. Periods that show a decline (economic recessions) are highlighted in gray. Our goal is to use SAHM to anticipate the likelihood of future economic growth or economic contraction.
Designating SAHM as favorable or unfavorable for the economy
To try to get meaningful results, at the end of the month, I look at the latest reading for SAHM is evaluated.
- If the value is below 0.30, the indicator is considered favorable for the economy
- If the value is 0.30 or higher, the indicator is considered unfavorable for the economy
NOTE: Using this method, even though the latest value (of 0.07) was reported on July 7th, the evaluation does not occur until the end of July 2023 (i.e., the indicator will be rated as favorable for August 2023).
I then keep track of two separate data series:
- A running total of monthly CEI changes if the previous month's SAHM value was BELOW 0.30
- A running total of monthly CEI changes if the last month's SAHM value was 0.30 or HIGHER
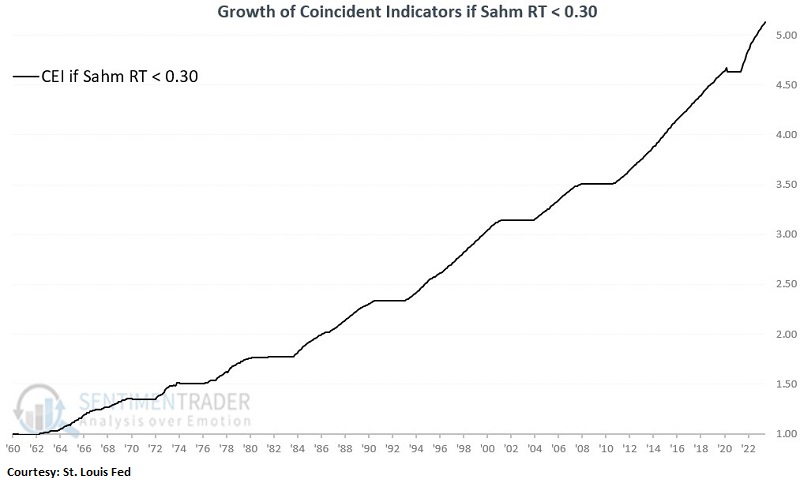
The chart below displays the cumulative +(-) for #1 above. In other words, it shows coincident economic growth only during months when SAHM ended the previous month < 0.30.
The chart below displays the cumulative +(-) for #2 above. In other words, it shows coincident economic growth only during months when SAHM ended the previous month >= 0.30.
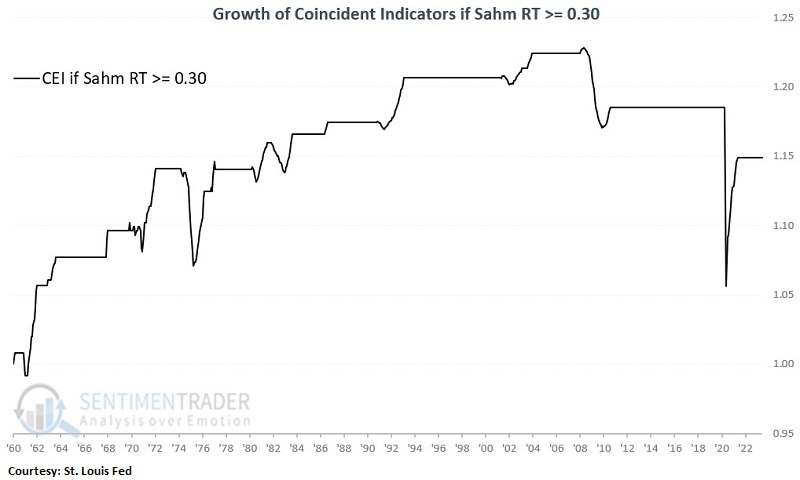
Notice any difference? A cursory glance reveals that the economy (again, as measured by the next month's gain or loss for the Coincident Economic Activity Index) has performed much better when SAHM was below 0.30.
The table below puts some numbers to the performance in the charts above.
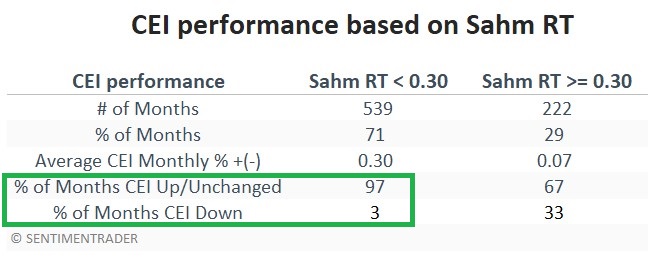
The key things to note are a) CEI increased or was unchanged during 97% of all months when SAHM ended the previous month below 0.30 (92% up months, 5% unchanged months), versus only 67% of all months when SAHM was 0.30 or higher (56% up months, 11% unchanged months). Also, CEI's average monthly % increase or decrease was over four times greater (0.30% versus 0.07%) when SAHM was below 0.30.
What the research tells us…
It should be noted that overall the Coincident Economic Activity Index gained ground during those months when SAHM was 0.30 or higher. So, it would be incorrect to argue that a reading of 0.30 or higher guarantees or even implies that a recession is imminent or ongoing. However, it is correct to argue that the likelihood of a recession was much greater when SAHM reached or exceeded that cutoff. Likewise, it can also be argued that - historically - the likelihood of a recession is very low while SAHM is below 0.30. While things can change quickly and exceptions to the rule are inevitable, the current Real-Time Sahm Recession Indicator reading of 0.07 suggests that concerns of an imminent recession are misguided.