
A trend-following approach to investing in commodities

Key points
- The term "commodities" covers a wide variety of materials and goods, each with its own unique supply and demand factors
- Via the use of commodity index ETFs, it is possible to participate in the price fluctuation of a basket of commodities
- A simple trend-following approach may allow investors the opportunity to profit from higher commodity prices
Commodities have been overshadowed by stocks and Bitcoin
It is somewhat of a misnomer to refer to "commodities as an asset class" because there are many different commodities, and the price of each fluctuates based on its own unique supply and demand factors. Soybeans grown in Illinois and coffee beans grown in Brazil have little in common. But both are considered "commodities" and may be included in a given tradable index of commodities.
Commodities have been an afterthought for many investors in recent years, as stocks and Bitcoin have generated outsized returns. But history suggests this relationship is not permanent. The chart below displays the relative performance between the Bloomberg Commodity Spot Price Index (BCOMSP) and the S&P 500 Index (SPX).
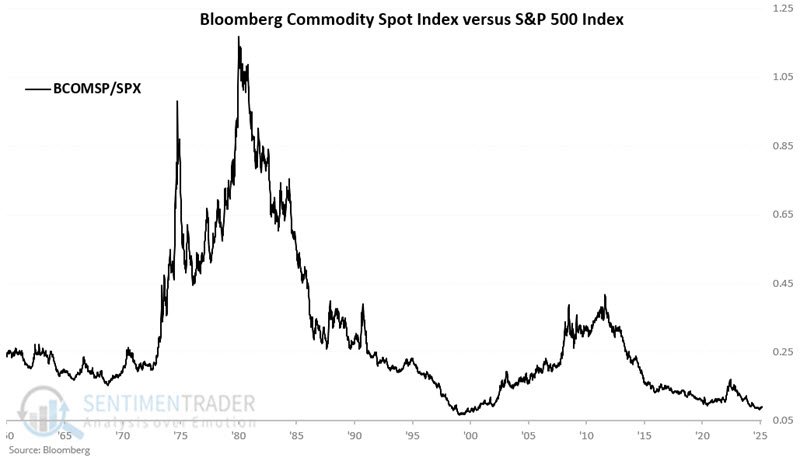
This ratio has been on the low side for several years and could conceivably remain that way indefinitely. Realistically, it is likely a waste of time to try to "predict" when this relationship will change and favor commodities again. A trend-following approach to commodities as an asset class may prove highly beneficial.
A trend-following approach
NOTE: The model I write about below is currently unavailable on the Sentimentrader website (because this is the first time I've written about it publicly), but I will ask the programming team to add it shortly. I refer to it as the ST Commodity Trend Model (STCTM for short). This model is deemed favorable or unfavorable for commodities as an asset class based on the trend of three commodity-related indexes.
The three indexes are:
- The Bloomberg Commodity Spot Price Index (BCOMSP)
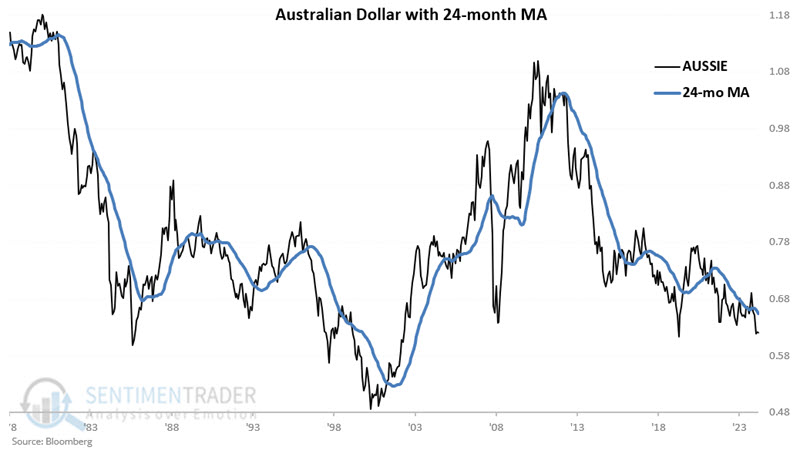
- The Australian Dollar (AUSSIE)
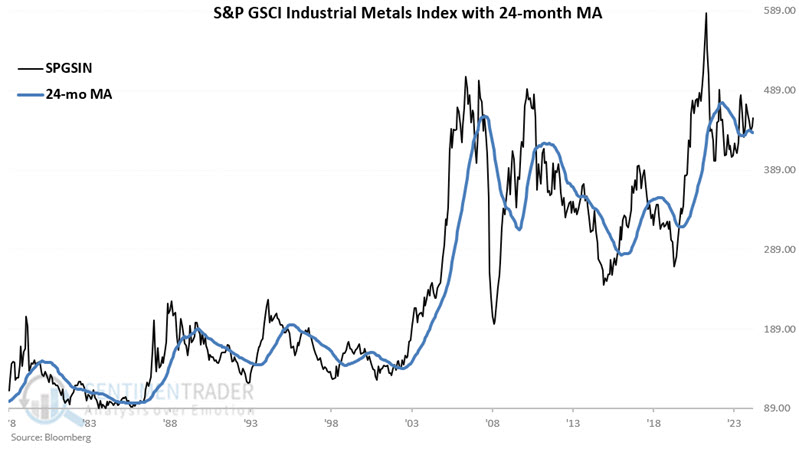
- The S&P GSCI Industrial Metals Index (SPGSIN)
At the end of each month, we compare the above indexes to their respective 24-month moving average of monthly closes. Closes above the 24-month average are considered favorable for commodities and vice versa. The charts below display each index versus its respective 24-month moving average.
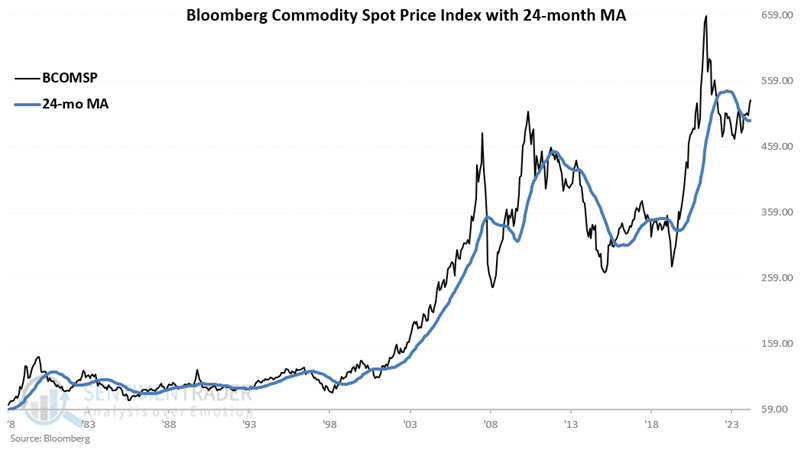
The ST Commodity Trend Model (STCTM) is calculated at the end of each month using the following variables:
A = Monthly close of the Bloomberg Commodity Spot Price Index
B = Monthly close for the Australian Dollar
C = Monthly close for the S&P GSCI Industrial Metals Index
D = 24-month simple moving average of A
E = 24-month simple moving average of B
F = 24-month simple moving average of C
G = A - D
H = B - E
I = C - F
J = If G >= 0 then J = +1else J = 0
K = If H >= 0 then K = +1 else K = 0
L = If I >= 0 then L = +1 else L = 0
STCTM = J + K + L
In plain English, if one of the indexes is above its 24-month moving average, then one point is added to the STCTM model. If all three are above their respective moving averages, STCTM = 3. If none are above their respective moving averages, then STCTM = 0. STCTM can read 3, 2, 1, or 0 at the end of a given month.
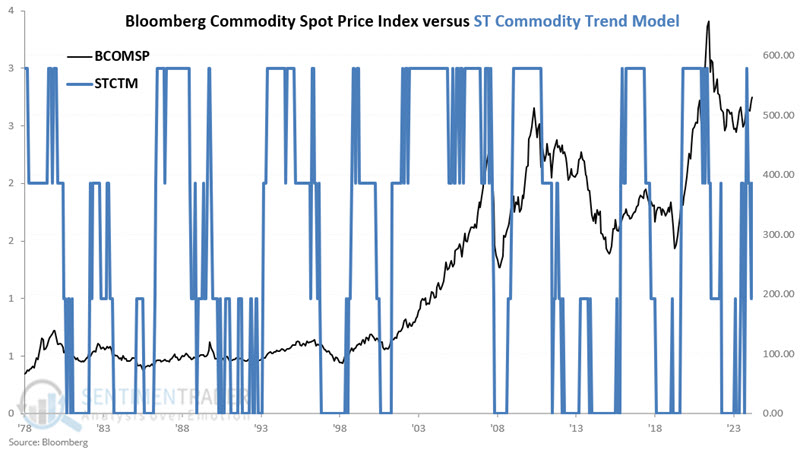
The chart below displays each month's STCTM reading and the Bloomberg Commodity Spot Price Index. The STCTM rose to a favorable +2 at the end of January 2025 and remained at a +2 reading at the end of February 2025.
For testing, we will use the Bloomberg Commodity Spot Price Index (BCOMSP) as our benchmark for commodity prices. Since SPGSIN's first month of data is January 1977, we will start our test after we have 24 months of SPGSIN data, i.e., at the end of December 1978.
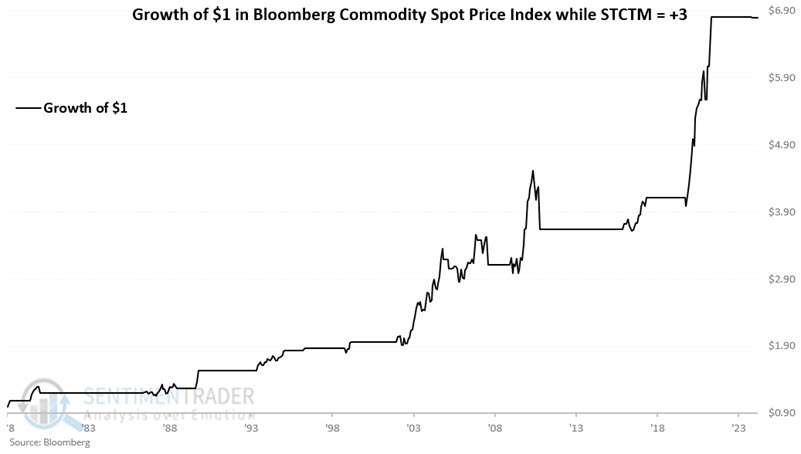
BCOMSP performance while STCTM = +3
The chart below displays the hypothetical growth of $1 invested in the Bloomberg Commodity Spot Price Index (BCOMSP) during months when the previous month ended with all three indexes above their respective moving averages, i.e., STCTM = +3. $1 grew +579% to $6.79.
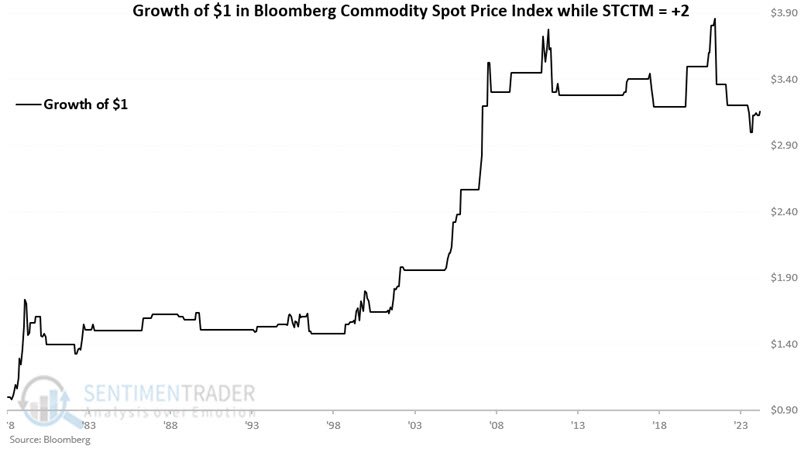
BCOMSP performance while STCTM = +2
The chart below displays the hypothetical growth of $1 invested in the Bloomberg Commodity Spot Price Index (BCOMSP) only during months when the previous month ended with two of the three indexes above their respective moving averages, i.e., STCTM = +2. $1 grew +216% to $3.16.
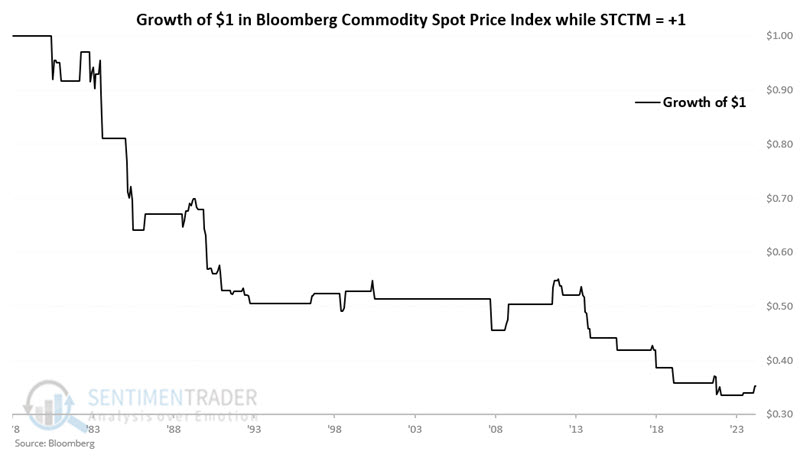
BCOMSP performance while STCTM = +1
The chart below displays the hypothetical growth of $1 invested in the Bloomberg Commodity Spot Price Index (BCOMSP) only during months when the previous month ended with only one of the three indexes above their respective moving averages, i.e., STCTM = +1. $1 Declined -65% to $0.35.
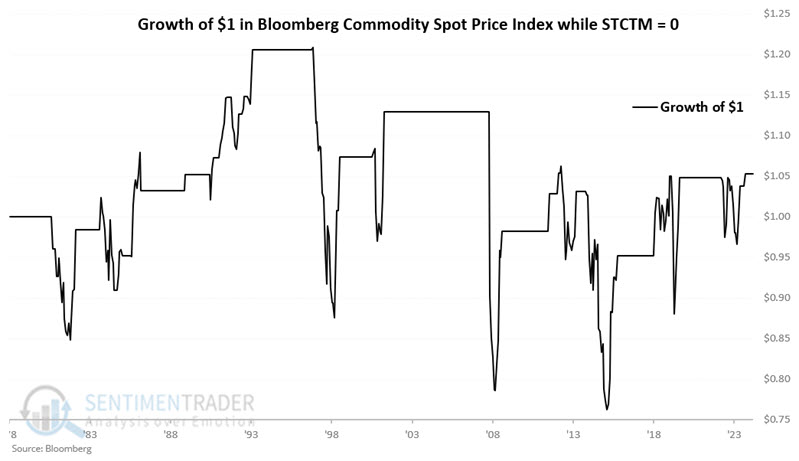
BCOMSP performance while STCTM = 0
The chart below displays the hypothetical growth of $1 invested in the Bloomberg Commodity Spot Price Index (BCOMSP) only during months when the previous month ended with all three indexes below their respective moving averages, i.e., STCTM = 0. $1 grew +5% to $1.05 (albeit it in a highly volatile and inconsistent fashion).
Applying rules to make STCTM systematic
For the record, we are not necessarily recommending that an investor use STCTM as a standalone trading system. Ideally, it would serve as weight of evidence in a broader approach. But for the sake of analysis, consider a strategy using the following rules:
- Buy the Bloomberg Commodity Spot Price Index (BCOMPSP) when STCTM rises to +2 or higher
- Sell the Bloomberg Commodity Spot Price Index (BCOMPSP) when STCTM falls to +1 or lower
The chart below displays the hypothetical growth of $1 invested in BCOMSP when STCTM was at +2 or +3 at the end of the previous month. $1 grew 2,044% to $21.44.
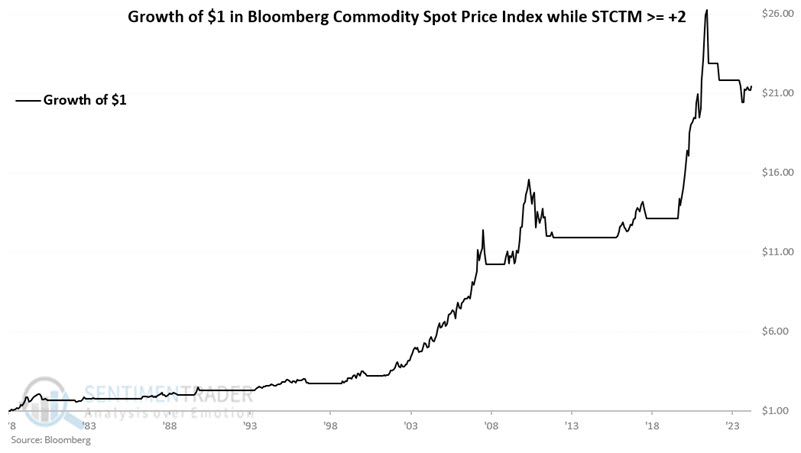
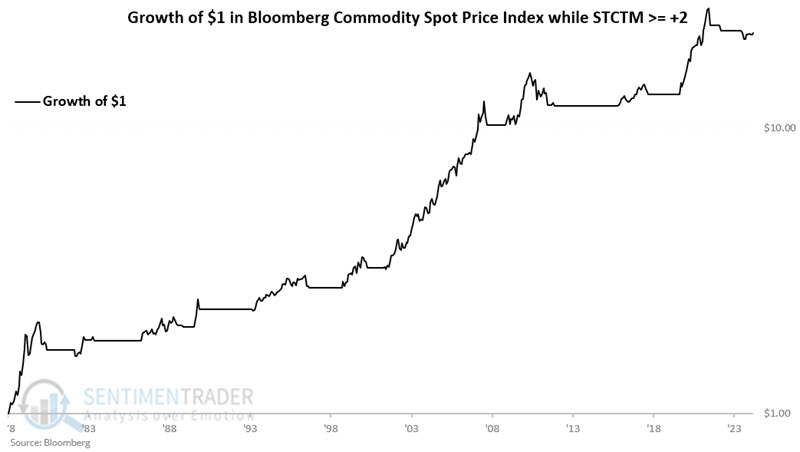
The chart below displays the same results on a logarithmic scale.
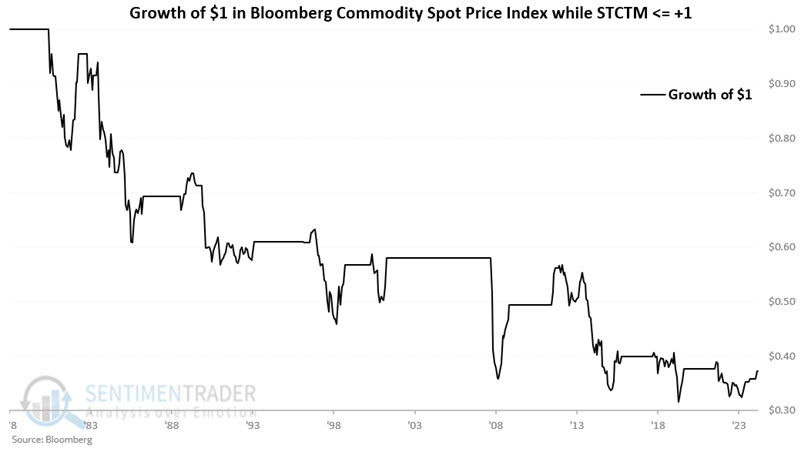
The chart below displays the hypothetical growth of $1 invested in BCOMSP when STCTM ended the previous month at +1 or 0. $1 declined 63% to $0.37.
Summarizing Results
The table below displays BCOMSP performance during +2 or higher periods.
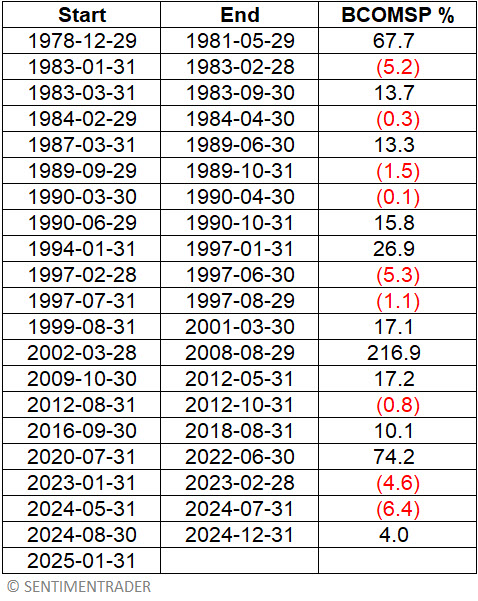
The table below summarizes BCOMSP's performance during "favorable" periods.
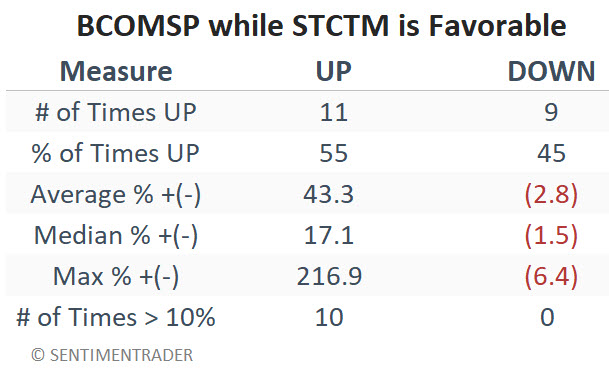
The operable phrase here might be, "When it's right, it's really right. When it's wrong, it's not that wrong." The less stellar news is the meager 55% Win Rate. However, the median % +(-) has been 17% for winning trades and less than -2% for losing trades. Likewise, moves of 10% or more have skewed 10 to 0 in favor of winning trades.
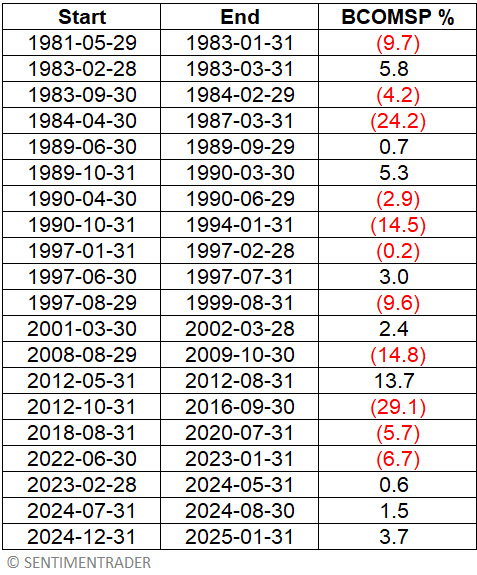
Now, let's examine unfavorable periods. The table below displays BCOMSP performance during periods with +1 or lower.
The table below summarizes BCOMSP's performance during "unfavorable" periods.
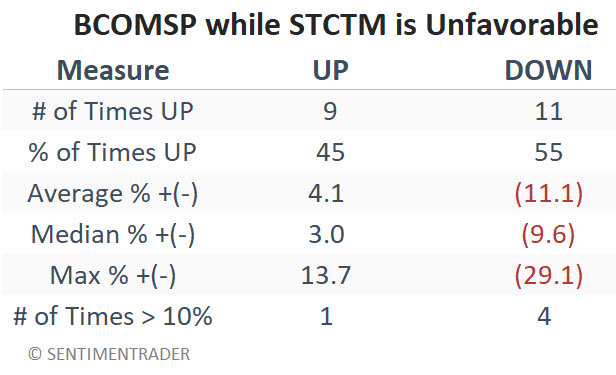
What the research tells us…
The method above is far from a perfect approach to trading commodities. The 55% Win Rate for favorable signals and 45% Win Rate for unfavorable signals suggest that any signal is only slightly better than a coin toss in terms of direction. Still, the difference between a +2,044% cumulative gain since 1978 for favorable periods versus a -63% cumulative loss during unfavorable periods is hard to overlook. These results suggest that there may be some benefit to applying a relatively simple trend-following approach to investing in commodity ETFs. More on that topic soon.