
A top 5 volatility scenario

Key points:
- A proxy index that tracks the VIX but goes back to 1962 has spiked to a historic level
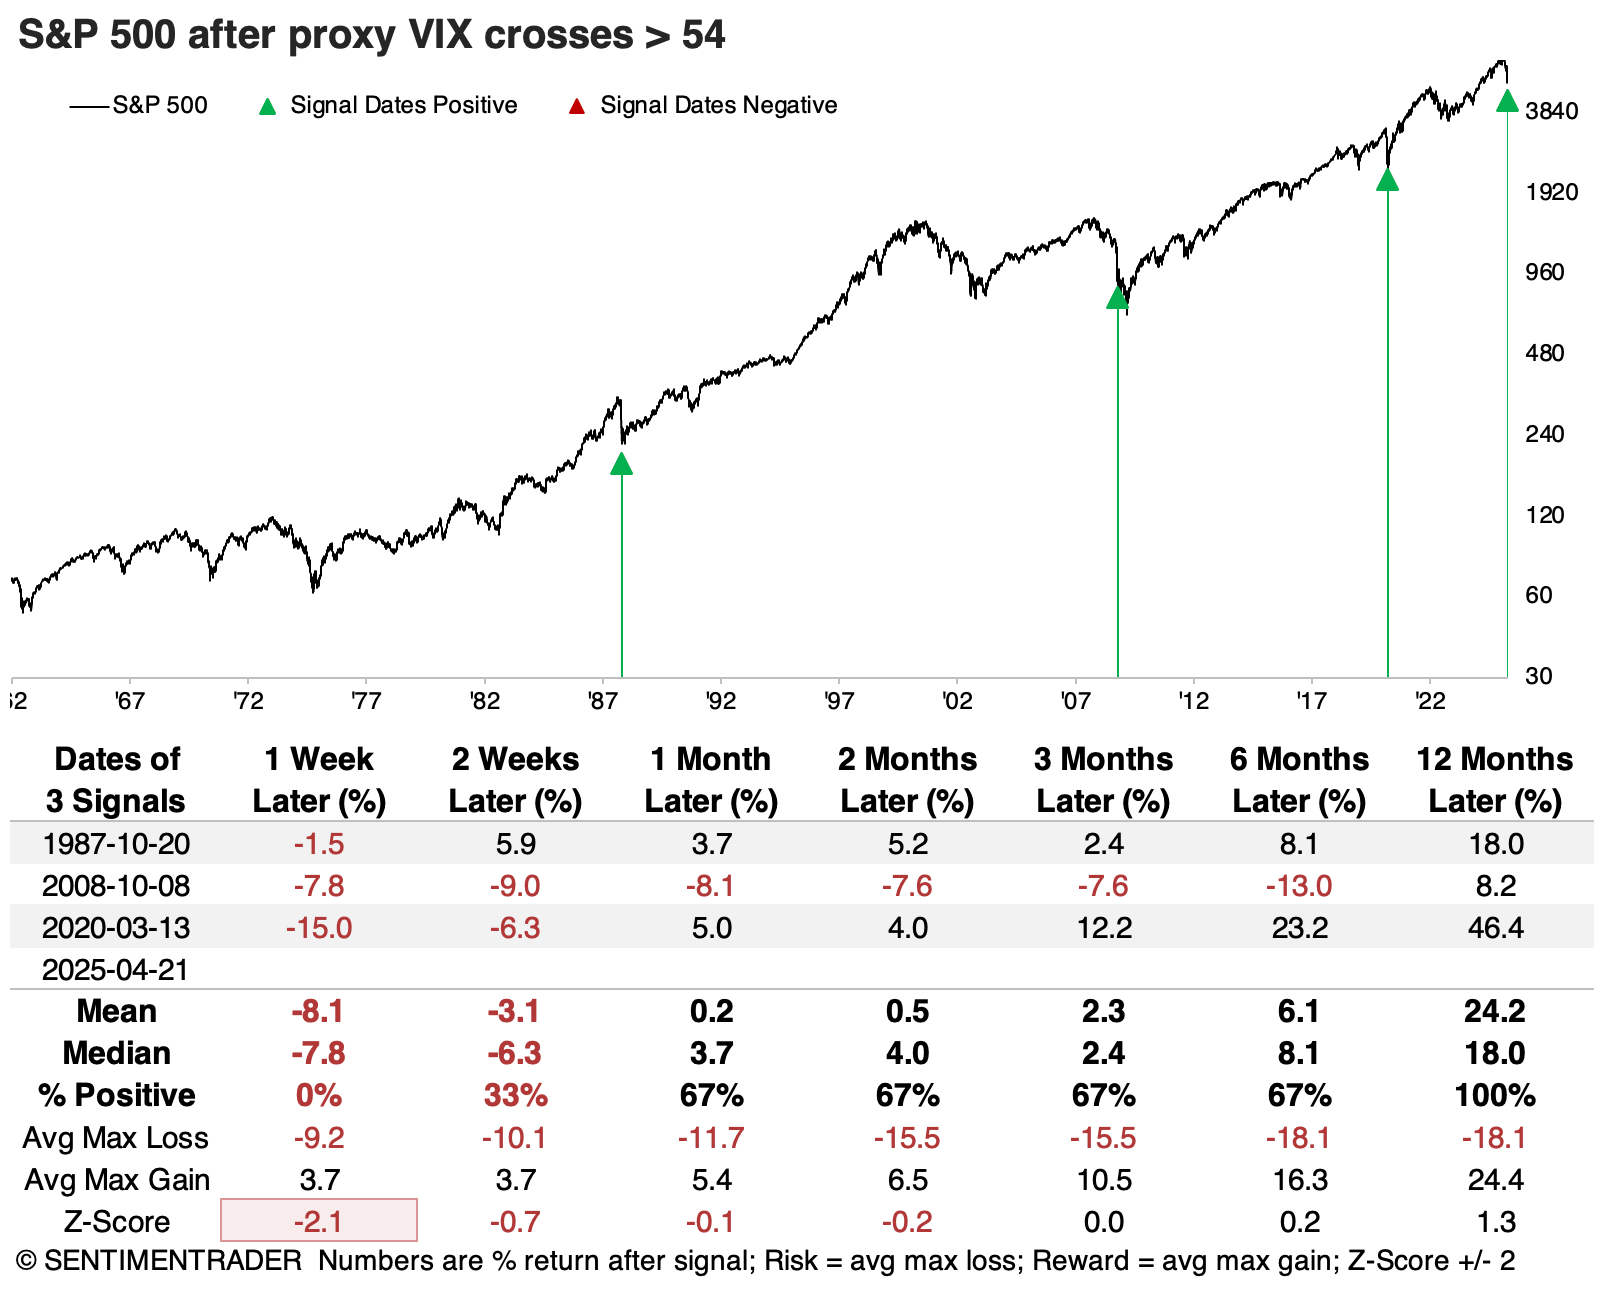
- The only precedents for the current level of volatility are three moments of global upheaval
- Markets recovered strongly after all three, and even relaxing the extreme threshold shows rare losses for stocks going forward
A volatility spike for the ages
It might seem like volatility has ebbed. Even though stocks keep swinging by 1% or 2% almost daily, at least it's down from the 5% swings from a couple of weeks ago.
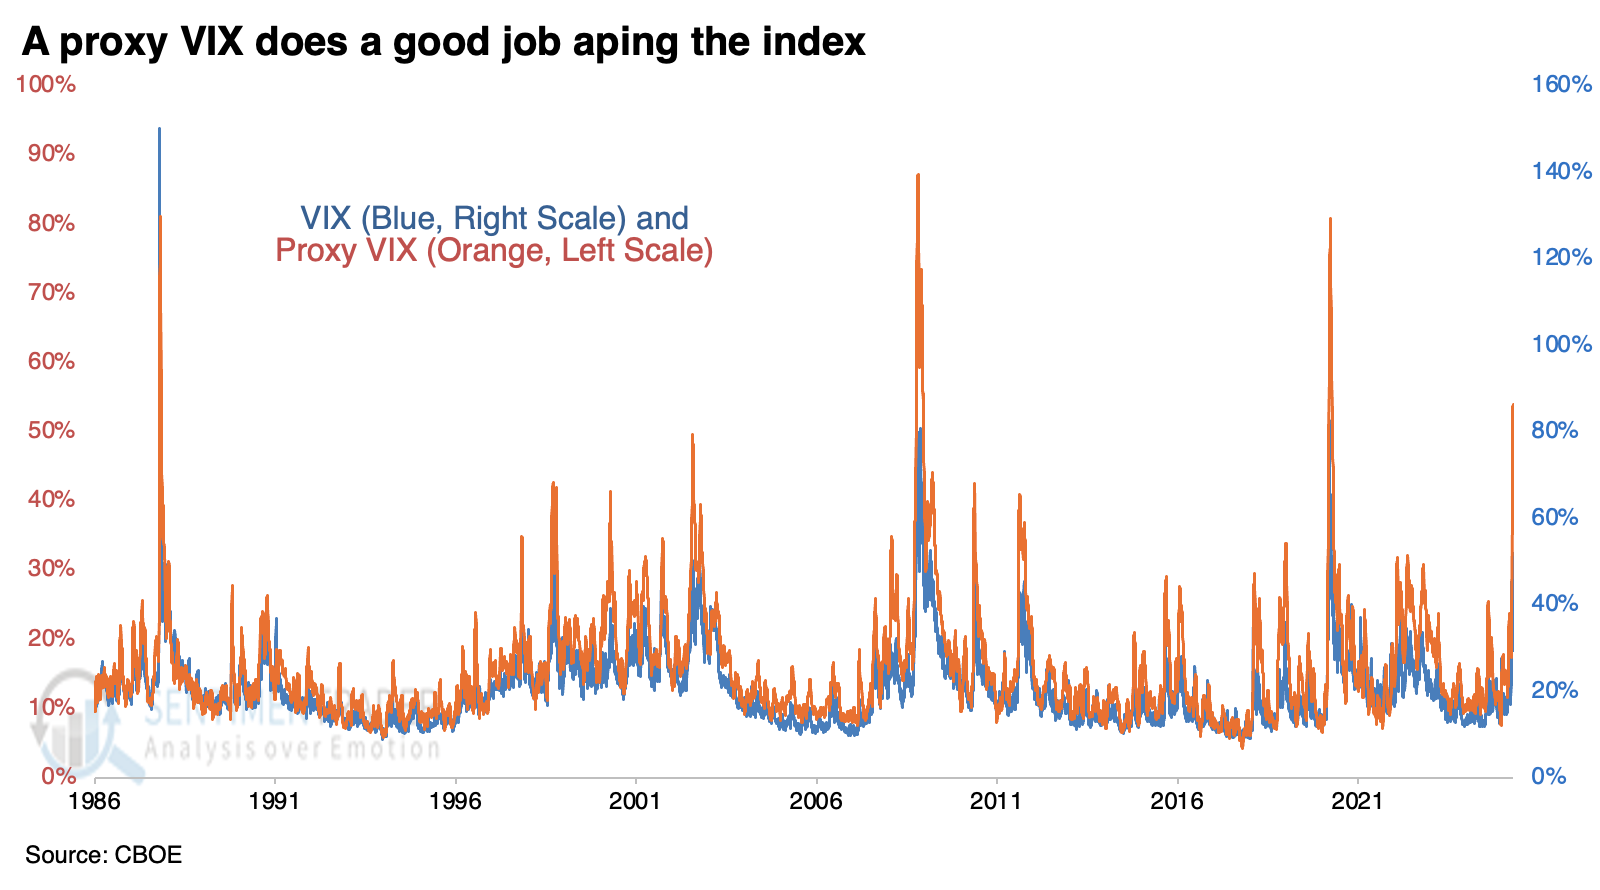
The VIX "fear gauge" that has become so popular has dropped by about half from its peak levels. But many games are being played in volatility futures and options, and it has become a bit more difficult to trust it. Besides, the VIX doesn't really predict volatility; options traders essentially just project current price swings into the near future.
We don't need anything besides open-high-low-close data to create an accurate proxy of the VIX. We've discussed this proxy VIX many times over the decades, which uses five academic models of volatility to estimate the VIX, without using options. It tracks the VIX remarkably closely.
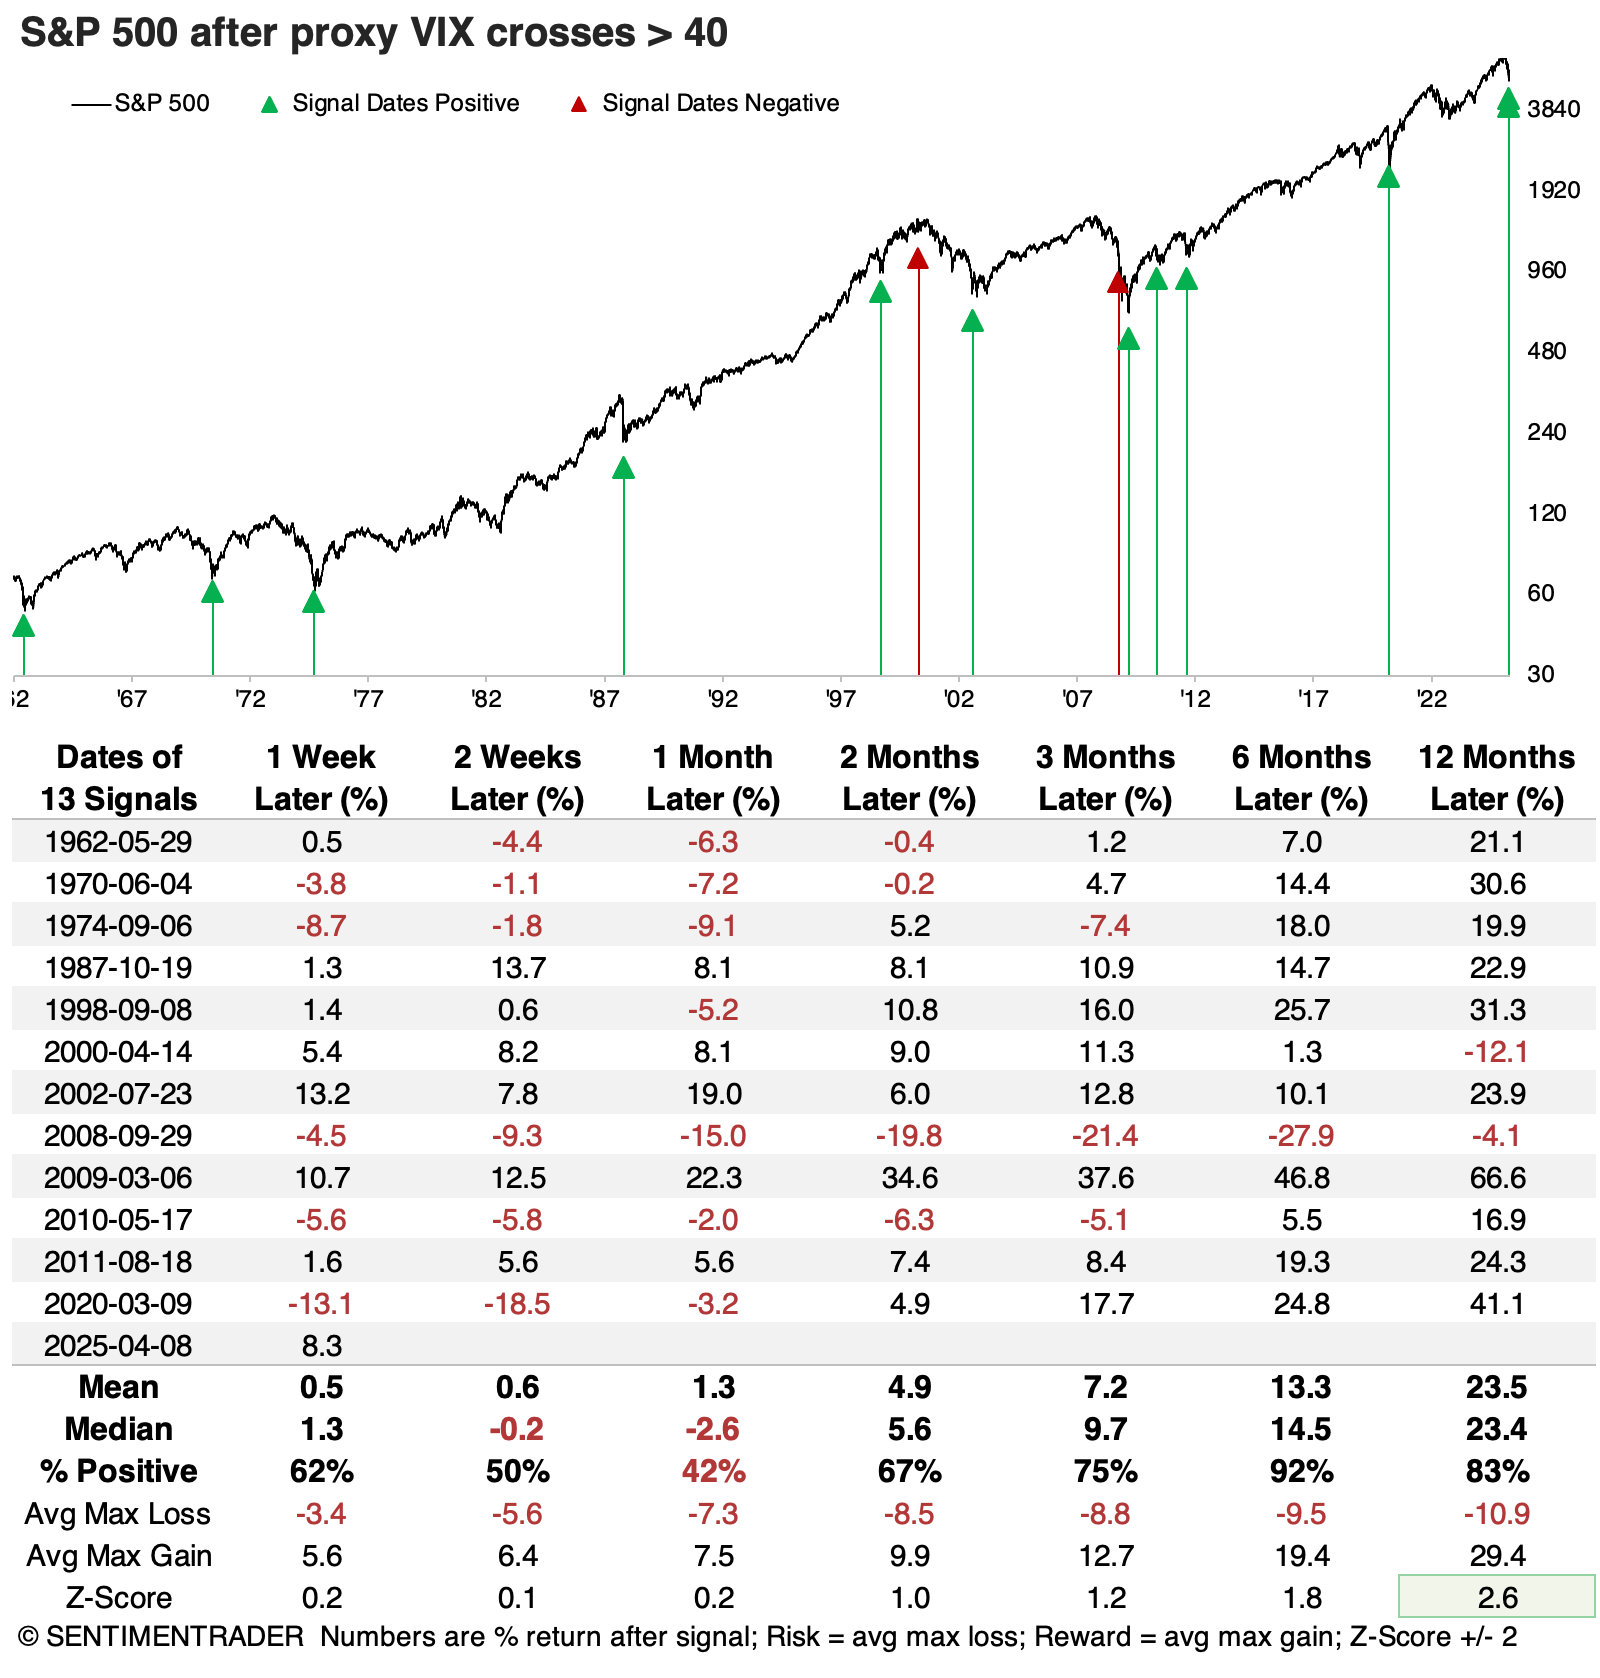
What's the point? Well, besides having a check against potentially skewed VIX readings, it allows us to go back further in history. Since we have intraday data dating back to 1962, we can essentially recreate the VIX back to then. When we do that, we can see that the current spike, which continues to escalate, now ranks 4th-highest in 63 years.
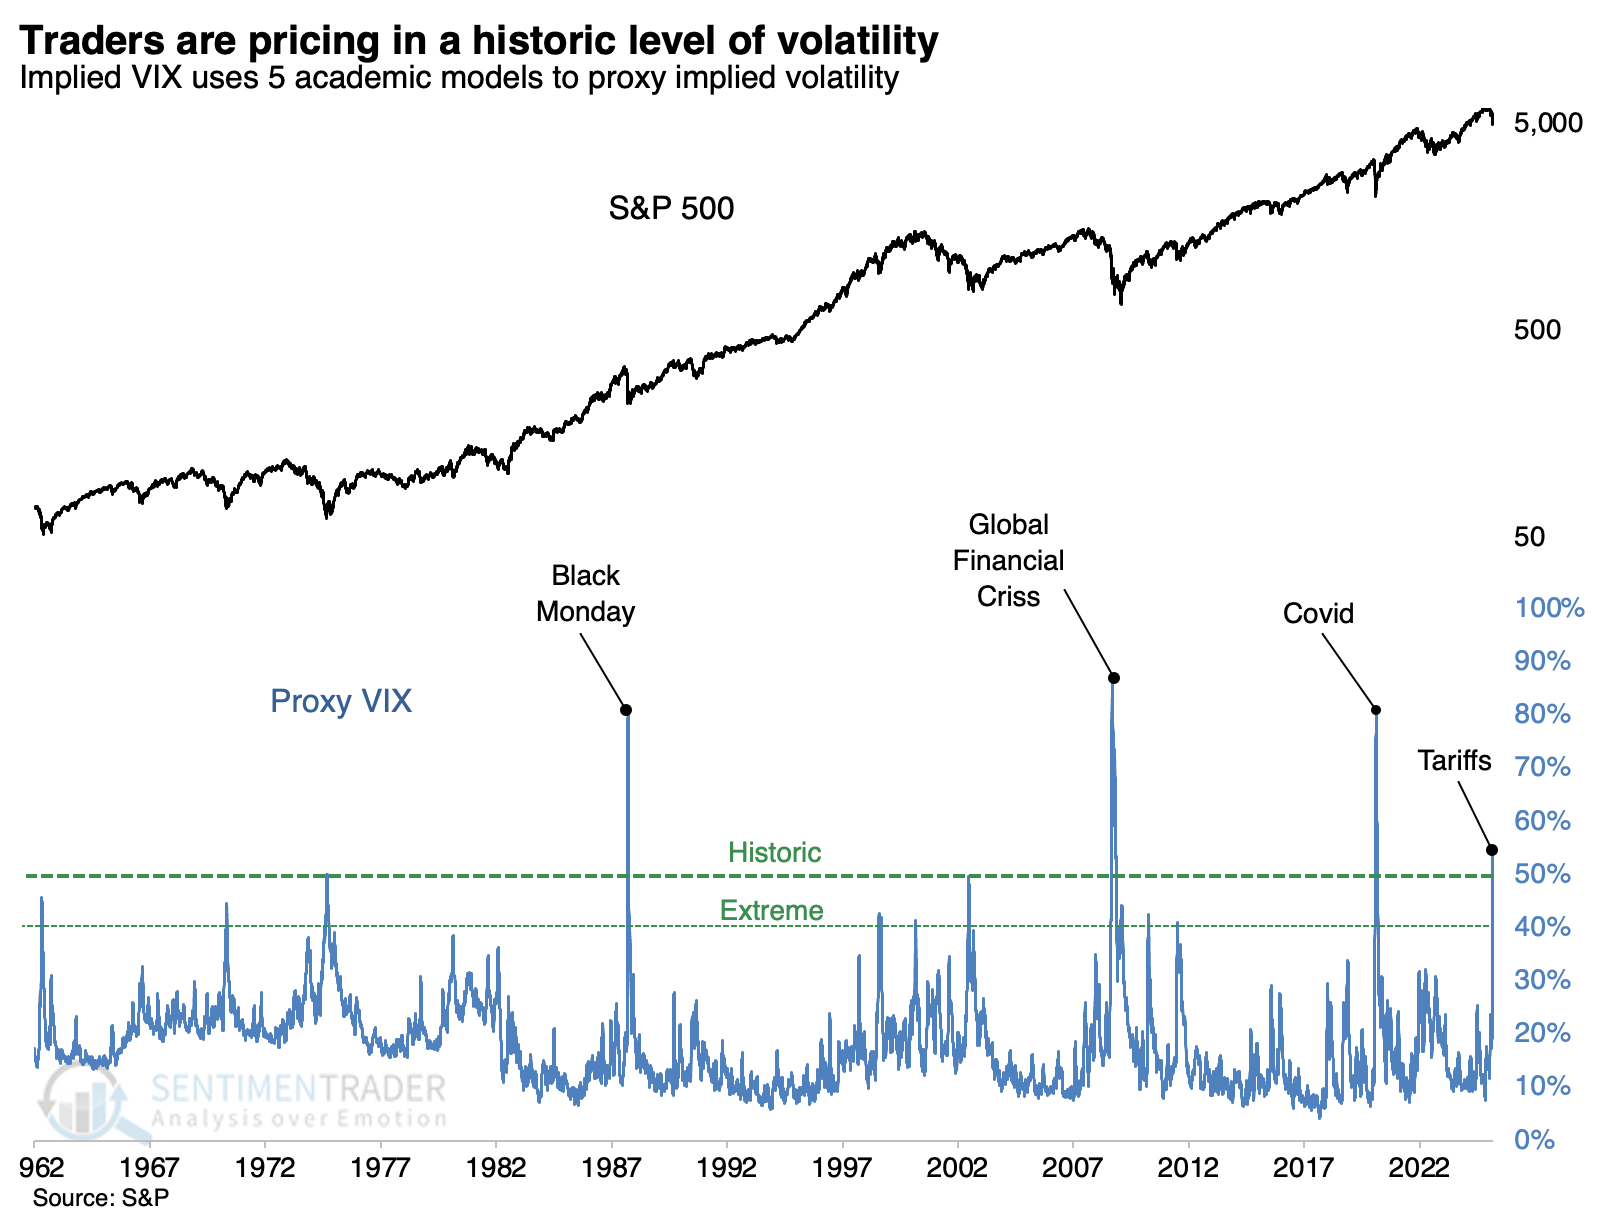
Historic, or even just extreme, volatility has rarely preceded losses
The chart above clearly reflects the historic nature of the tariff tantrum. The only equivalents were three of the most upsetting conditions in modern history. The table below shows S&P 500 returns after the three other times the proxy VIX reached its current threshold.
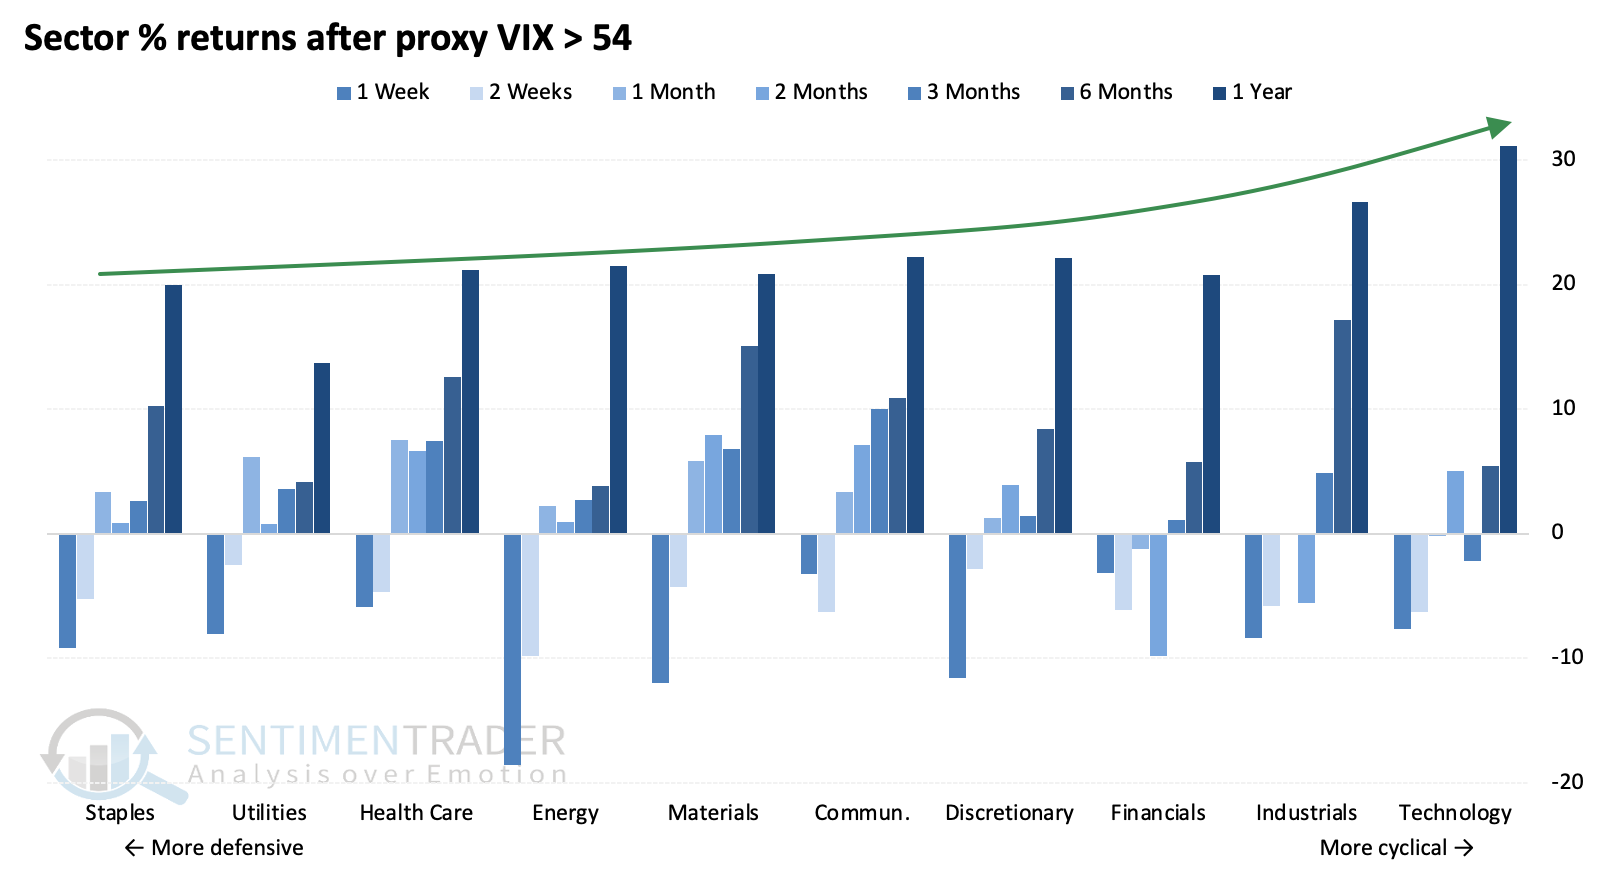
Over the last couple of weeks, we've noted that studies started to skew towards more positive medium- to long-term returns for cyclical sectors versus defensive ones. This has been a stark change from the prior few months. We see this skew in this study, as well.
Relying on a sample size of three of sketchy, so the table below relaxes the extreme threshold to 40%. That increases the sample size considerably, and the signals were still impressive over longer time frames.
There was only one negative return six months later. The two negative returns over the following year were the two most drastic protracted meltdowns in recent history, so we'd have to expect something of a repeat here to assume the current signal would also result in a negative return.
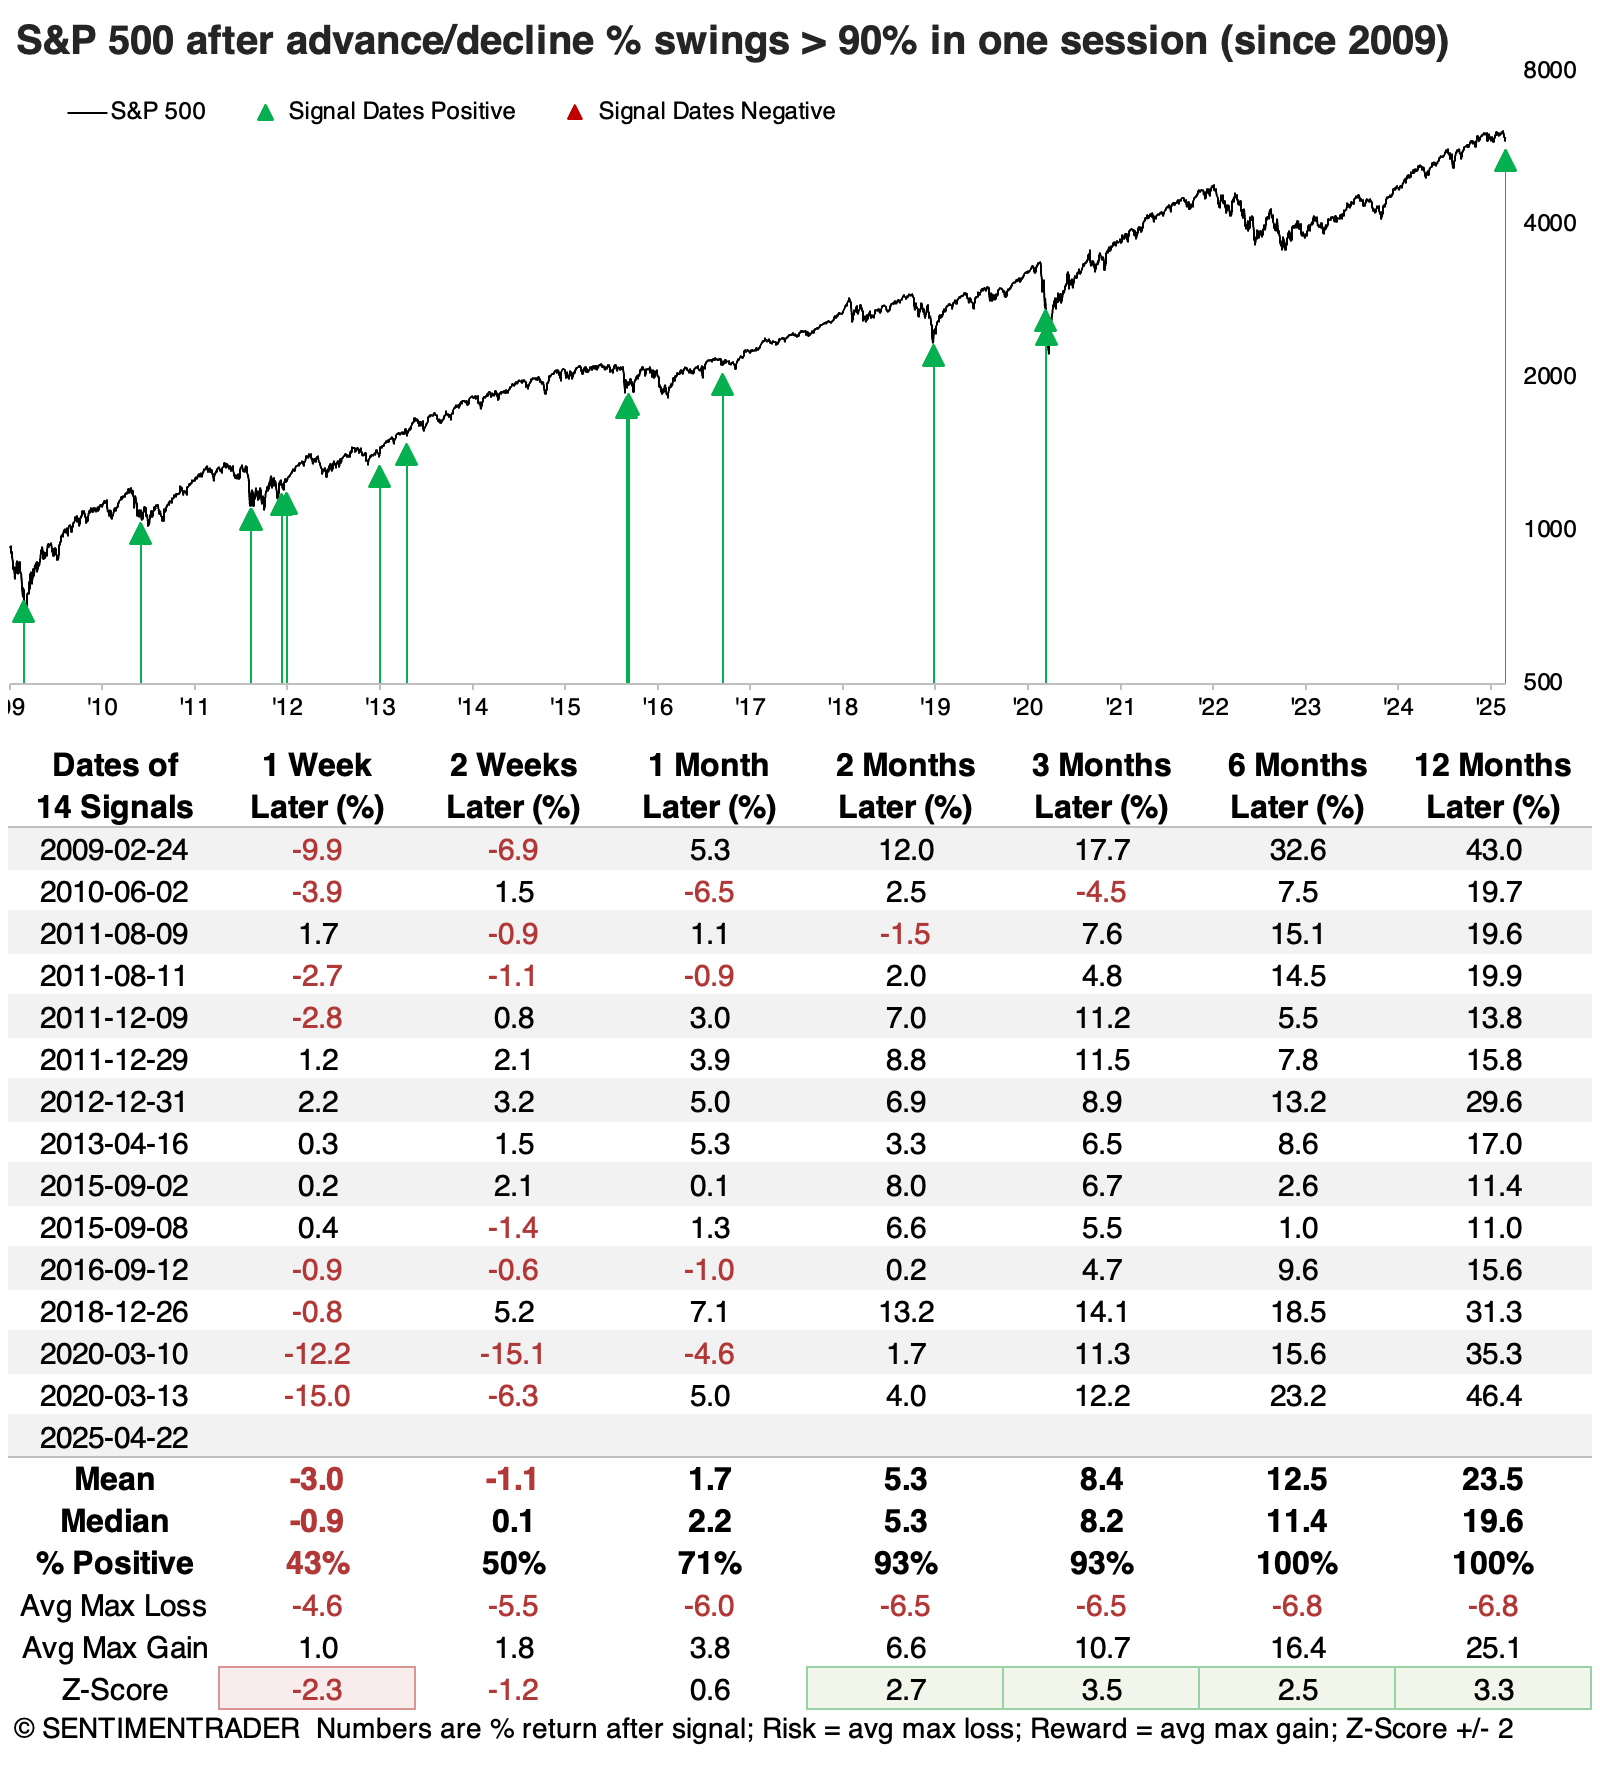
These drastic swings in the level of the S&P 500 are, of course, driven by what has become increasingly all-or-nothing buying and selling pressure in individual stocks.
On Monday, fewer than 8% of S&P 500 stocks advanced on the day. On Tuesday, that swung to more than 98% of them. Since the end of the financial crisis, when these swings became more common (it never happened before 2007), one-day swings of more than 90% in advancing issues have reliably occurred near the end of corrective periods.
What the research tells us...
Whenever volatility spikes, it seems inconceivable that it will ever retreat again. Just look at some of the doomer headlines and hysterical articles out there. It's like nobody has ever lived through market swings before. Many haven't, apparently.
What we've seen over the last two weeks is par for the course for a volatility spike, and there is little reason to believe the outcome will be much different. While the investors and circumstances are always different, the bottom line is we're still dealing with human nature, and that never changes much. Spikes, as we've seen, tend to continue to precede high volatility over shorter time frames, say several weeks. But after that, expectations for calmer conditions and higher prices rise significantly, with few instances of negative returns over three months and longer.