
A time for speculators to look at wheat

Key Points
- Wheat tends to make several large swings within a calendar year
- Very often, these swings adhere closely to several favorable and unfavorable seasonal periods
- Given that wheat has plunged 65% in price over the past three and a half years, and is now entering one of the most favorable periods of the year, aggressive speculators should be looking for an opportunity to play the long side
Wheat has been a dreadful performer for years
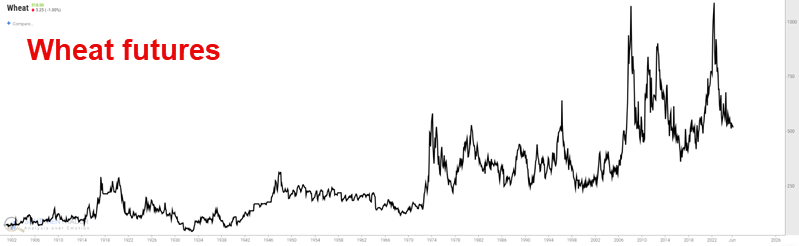
Due to the vagaries of the planting and growing cycles and the unpredictability of weather in locations where wheat is grown, wheat has been one of the most highly cyclical commodities. This fact is readily apparent in a monthly chart of wheat futures prices going back to the start of the previous century.
In the weekly chart below, we can note that in the past three and a half years, wheat has plunged 65% in price. However, momentum has begun to swing back to the upside, and previous upswings have often presaged significant subsequent rallies.
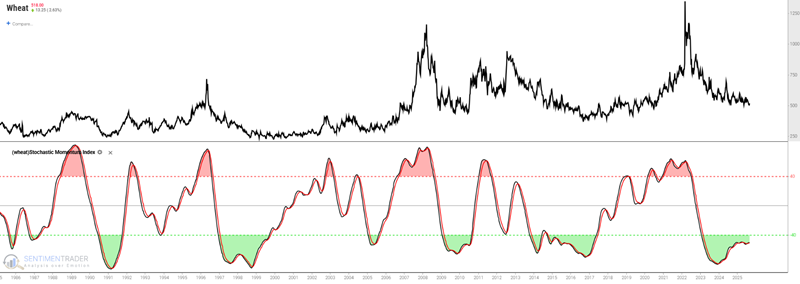
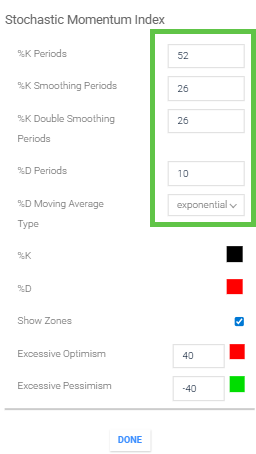
The Stochastics Momentum Index in the chart above uses the parameter values below.
There is another reason that aggressive speculators should be looking for an opportunity to play the long side of wheat.
Wheat tends to show strength during the Fall
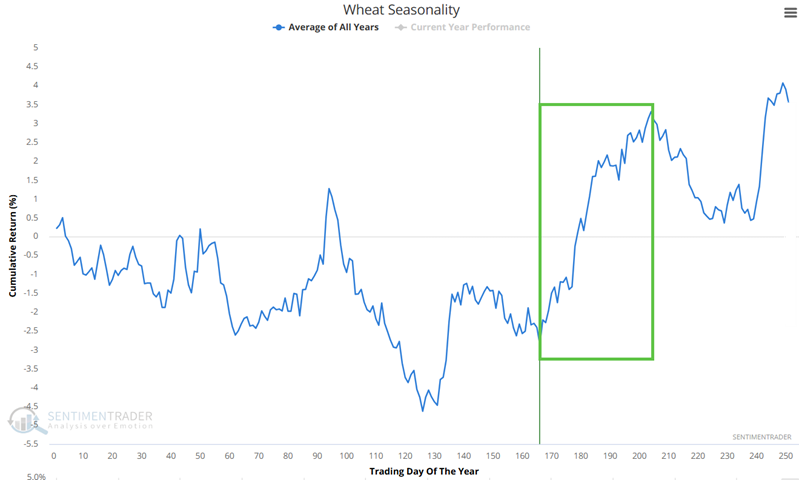
I typically look for opportunities where price action and seasonality are in agreement. This situation is an exception to that general rule. The typical seasonal pattern for wheat suggests that this is a time when we should be looking for - and being prepared to act upon - favorable price action.
The chart below shows the Annual Seasonal Trend for wheat and a typical seasonal strength period extending from Trading Day of the Year #166 through TDY #204. For 2025, this period extends from the close on August 29th through October 13th.
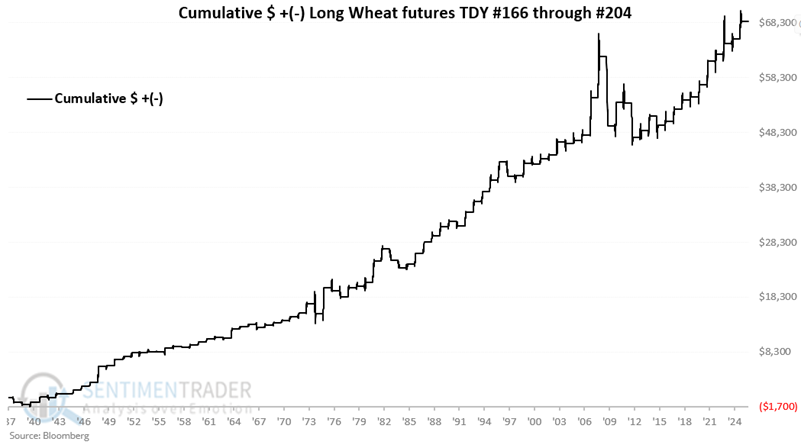
The chart below displays the hypothetical cumulative $ +(-) achieved by holding a long position in wheat futures only during the TDY #166 to TDY #204 period every year since 1937. The significant losses in 2008 and 2011 remind us that seasonal strength is never guaranteed and that a stop-loss strategy is essential
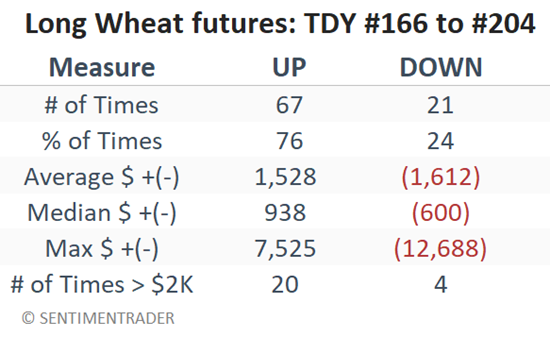
The table below summarizes wheat futures performance during this period. Three out of four years have shown a gain, and moves of $2K or more have skewed favorable by a factor of 5-to-1.
An ETF alternative for non-futures traders
The Teucrium Wheat Fund (ticker WEAT) is an ETF that tracks wheat futures contracts. Traders can buy and sell shares of this ETF just as they would any other stock or ETF. Buying WEAT shares allows non-futures traders to participate in any advance in the price of wheat. The chart below (courtesy of AIQ TradingExpert) displays the weekly history for ticker WEAT.
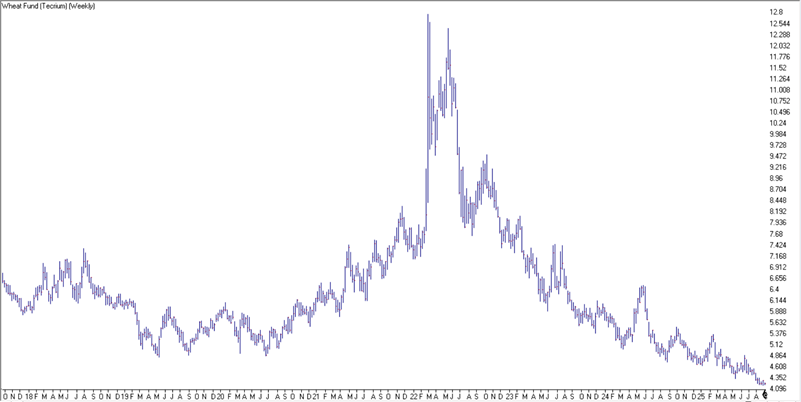
Does this look like a pattern that represents a buying opportunity? Most traders would likely shout a resounding "No!" - myself typically included. We see above a security in a relentless multi-year decline, flirting with ever-lower new lows.
Am I suggesting attempting to buy the exact bottom? Not really. However, if WEAT can take out its recent short-term high above $4.28, a long position with a stop-loss somewhere below its recent low of $4.17 could represent a relatively low-risk speculation.
What the research tells us…
Over 88 years, wheat has advanced in price 76% of the time during the period we detailed above. This tells us there is an edge if we look solely at probability. Wheat is also incredibly oversold. I personally rarely attempt to "buy bottoms." For this reason, I would look for a bounce before jumping in, with a stop-loss below the recent low. Given the risky nature of this setup, a modest position size is appropriate - i.e., do not bet the ranch. It should also be noted that this setup is the type of trade that can result in a losing trade within moments of entry if the bounce fails. Speculators only need apply.