
A tightening in financial conditions triggers a sell signal for stocks

Key points:
- A trend-following model based on the Goldman Sachs Financial Conditions Index signals risk-off
- Periods with tightening financial conditions underperform phases when conditions are easing
- Defensive sectors typically fare better than other groups in similar circumstances
Financial conditions are tightening, suggesting stocks could struggle
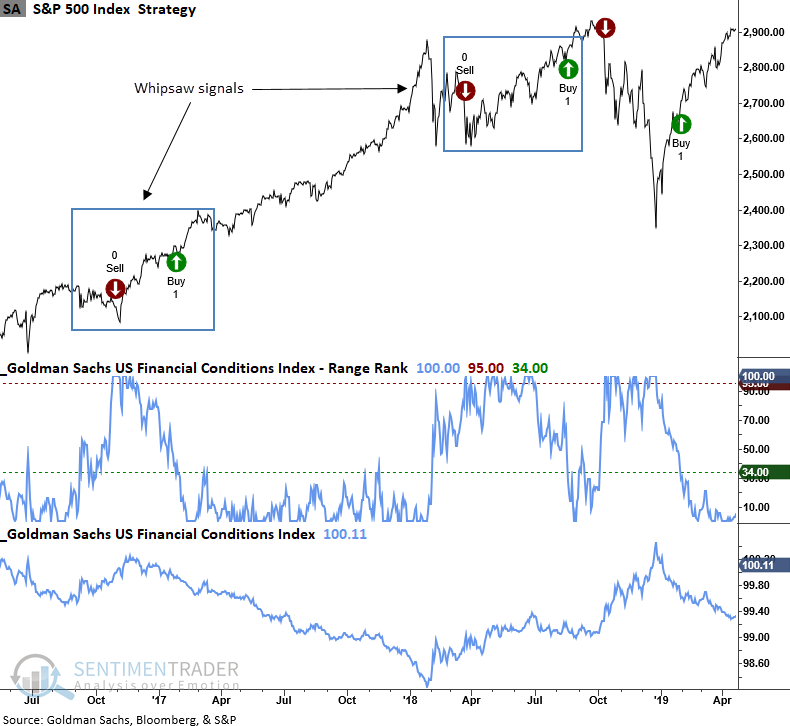
A trend-following system that measures when the Goldman Sachs Financial Conditions Index is easing or tightening triggers a new sell signal for the S&P 500.
If you recall, the model moved to a bullish trend condition on 2023-01-06, capturing an 11% gain with the sell signal on Thursday.
The model applies an 84-day range rank to the Goldman Sachs Financial Conditions Index. When the range rank declines below the 34th percentile, and price momentum for the S&P 500 is positive, the system goes long. Conversely, the model issues a sell signal when the range rank increases above the 95th percentile and the S&P 500 exhibits negative price momentum.
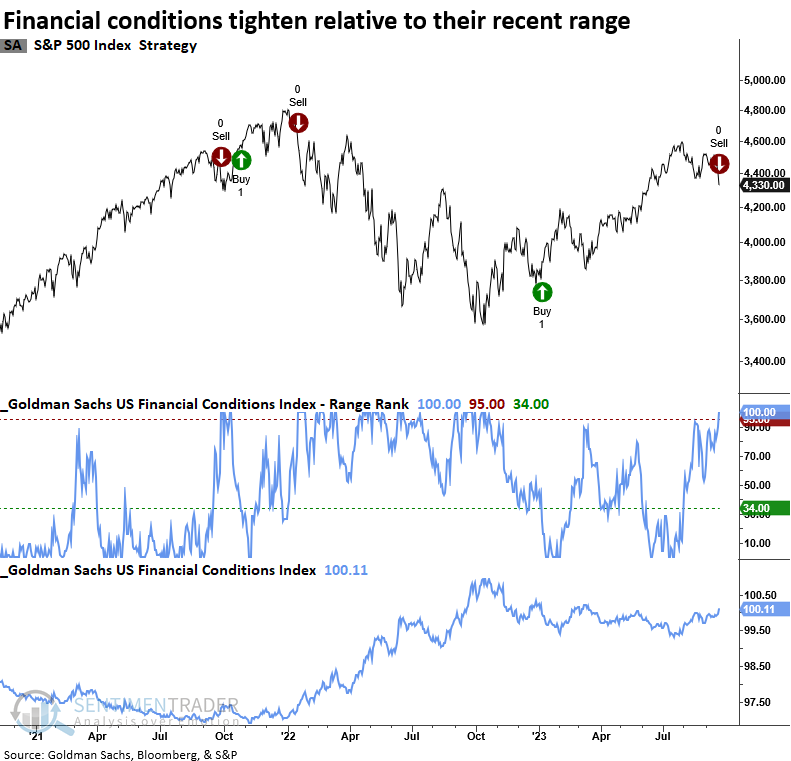
In July, I highlighted a 6-month low in the financial conditions index. Initially, the S&P 500 exhibited strong performance, with a maximum gain of 1.7% during the first month. However, this promising start was short-lived as financial conditions began to tighten, causing the signal to lose strength.
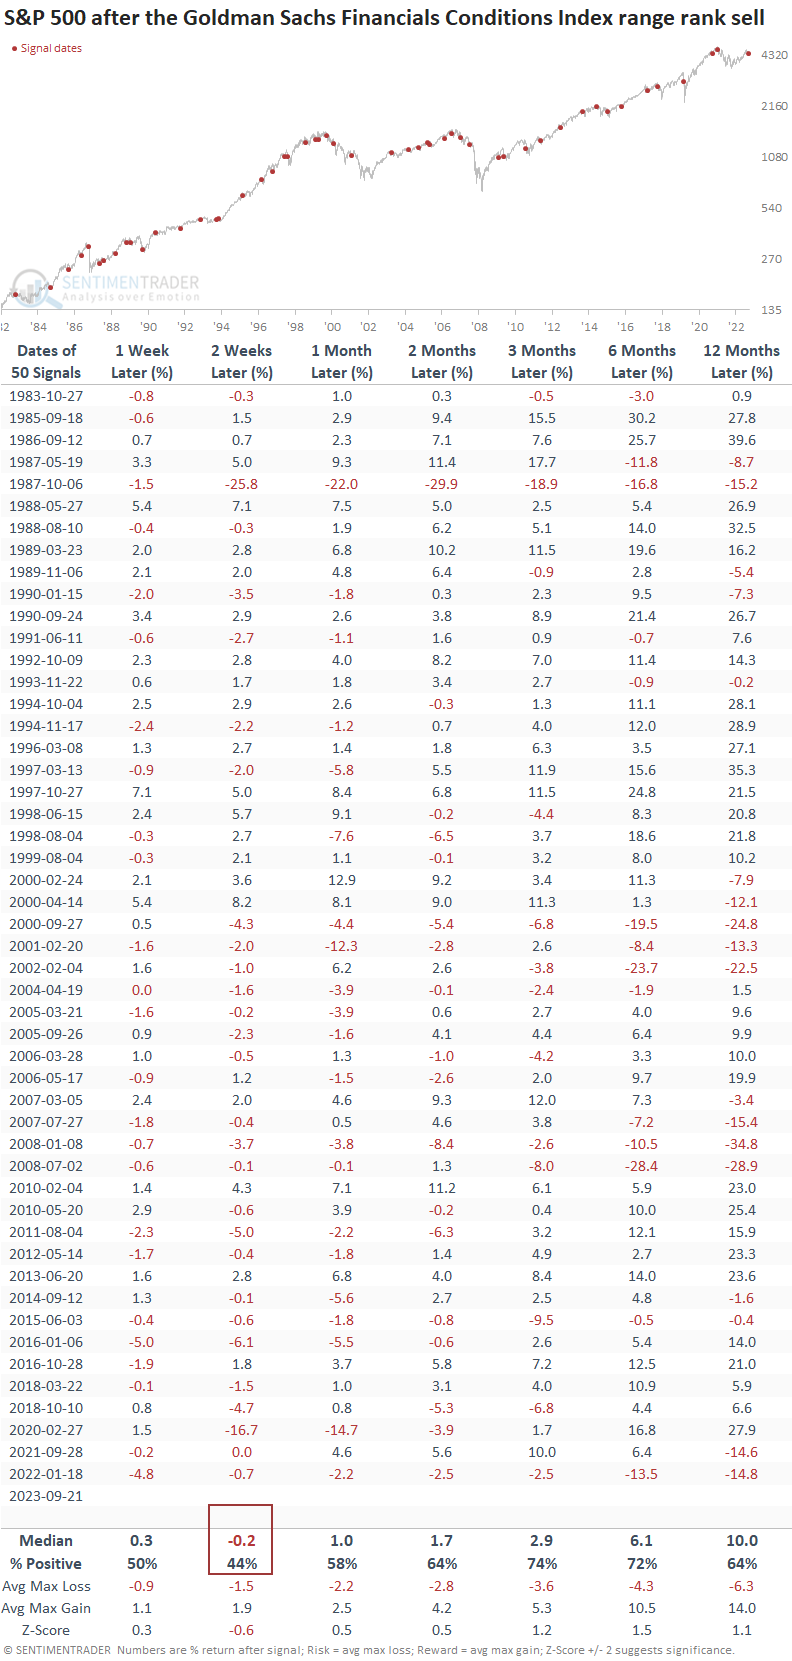
Similar reversals in financial conditions preceded negative returns
When the range rank for the Goldman Sachs Financial Conditions Index reverses from a period of easing to tightening, the S&P 500 tends to struggle over the next few weeks. Since 2001, the likelihood of producing an unfavorable outlook has been more pronounced, with 22 out of 25 occurrences showing negative returns at some point over the same period.
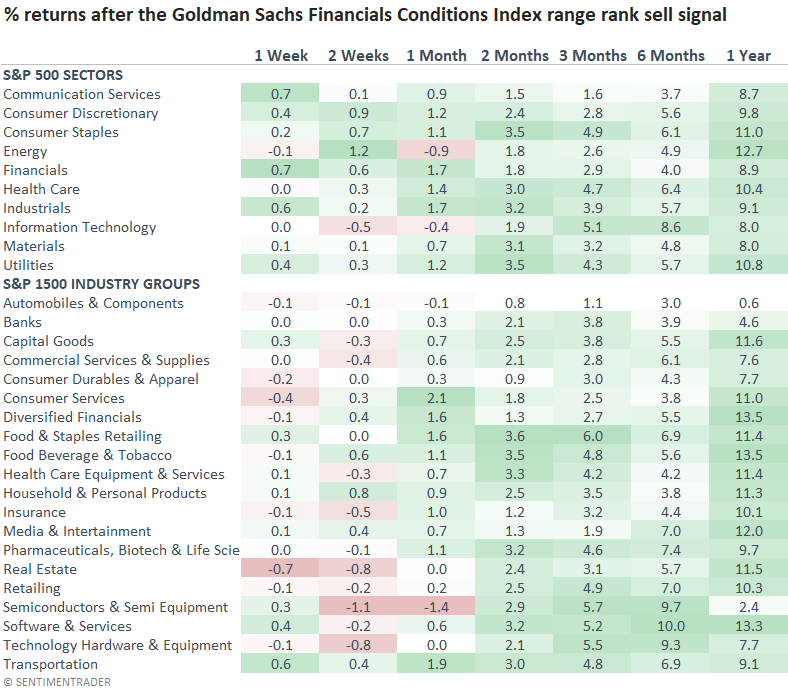
When financial conditions tighten, defensive sectors like Consumer Staples, Health Care, and Utilities tend to outperform other groups over the subsequent year. Technology, a year-to-date leader, could underperform relative to other sectors if history rhymes.
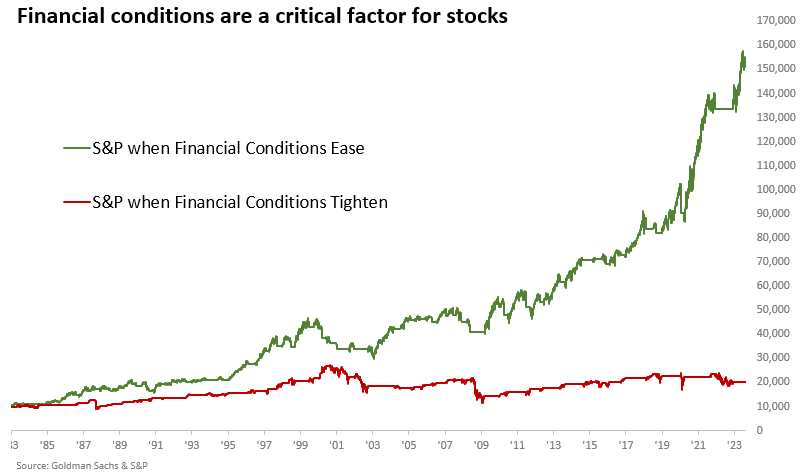
Generally, stocks prosper when financial conditions are easing, not tightening
When it comes to trend-following systems that are either all in or out, measuring performance based on the growth of an initial investment is a more appropriate methodology to assess the strategy's validity.
Utilizing the trend-following rules, a $10,000 investment in the S&P 500 increases to $151,000 when financial conditions ease. Conversely, tightening financial conditions results in significantly smaller growth, with the initial investment reaching only $20,000.
Trend-following systems are susceptible to whipsaw signals
One of the frustrating aspects of trend-following systems is their susceptibility to whipsaw alerts. With stocks showing initial signs of an oversold condition and seasonality getting closer to a more favorable period, we must be mindful of this potential outcome. For this reason, I always prefer a weight-of-the-evidence approach over a single indicator or model.
What the research tells us...
A trend-following system that uses the Goldman Sachs Financial Conditions Index cycled from a period of easing to tightening, triggering a sell signal for the S&P 500. Similar alerts displayed weak results for the S&P 500 over the next few weeks, especially since 2001. When assessing the outlook for the S&P 500 based on the growth of an initial capital outlay, the S&P 500 grows from $10,000 to $20,000 in tightening phases, significantly underperforming the gain of $151,000 in easing conditions. Defensive sectors typically outperform other groups when financial conditions tighten.