
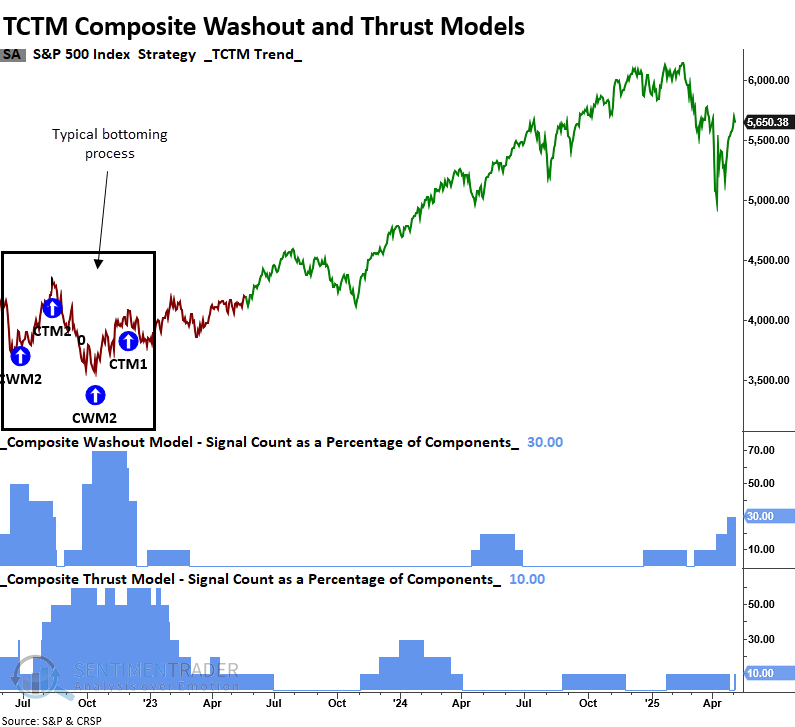
A TCTM thrust model component triggered a signal

Key points:
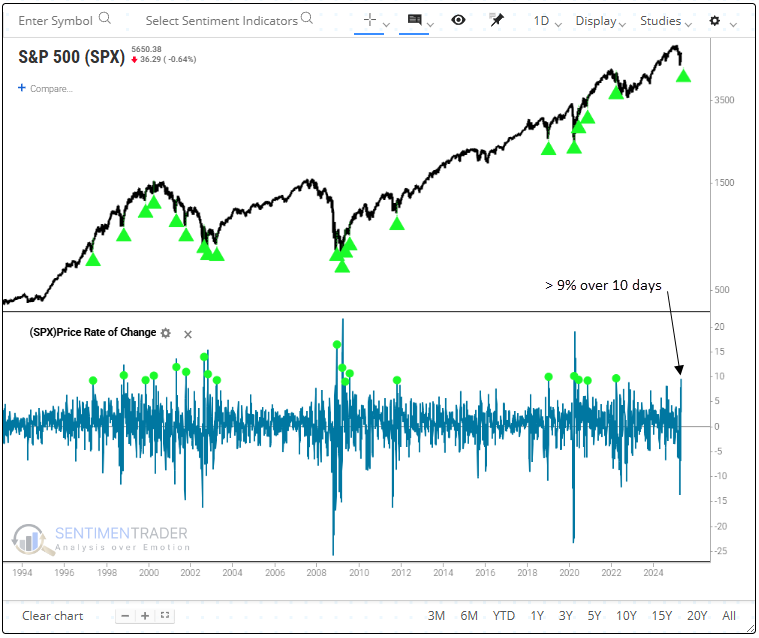
- Over the last ten trading sessions, the S&P 500 surged by more than 9%
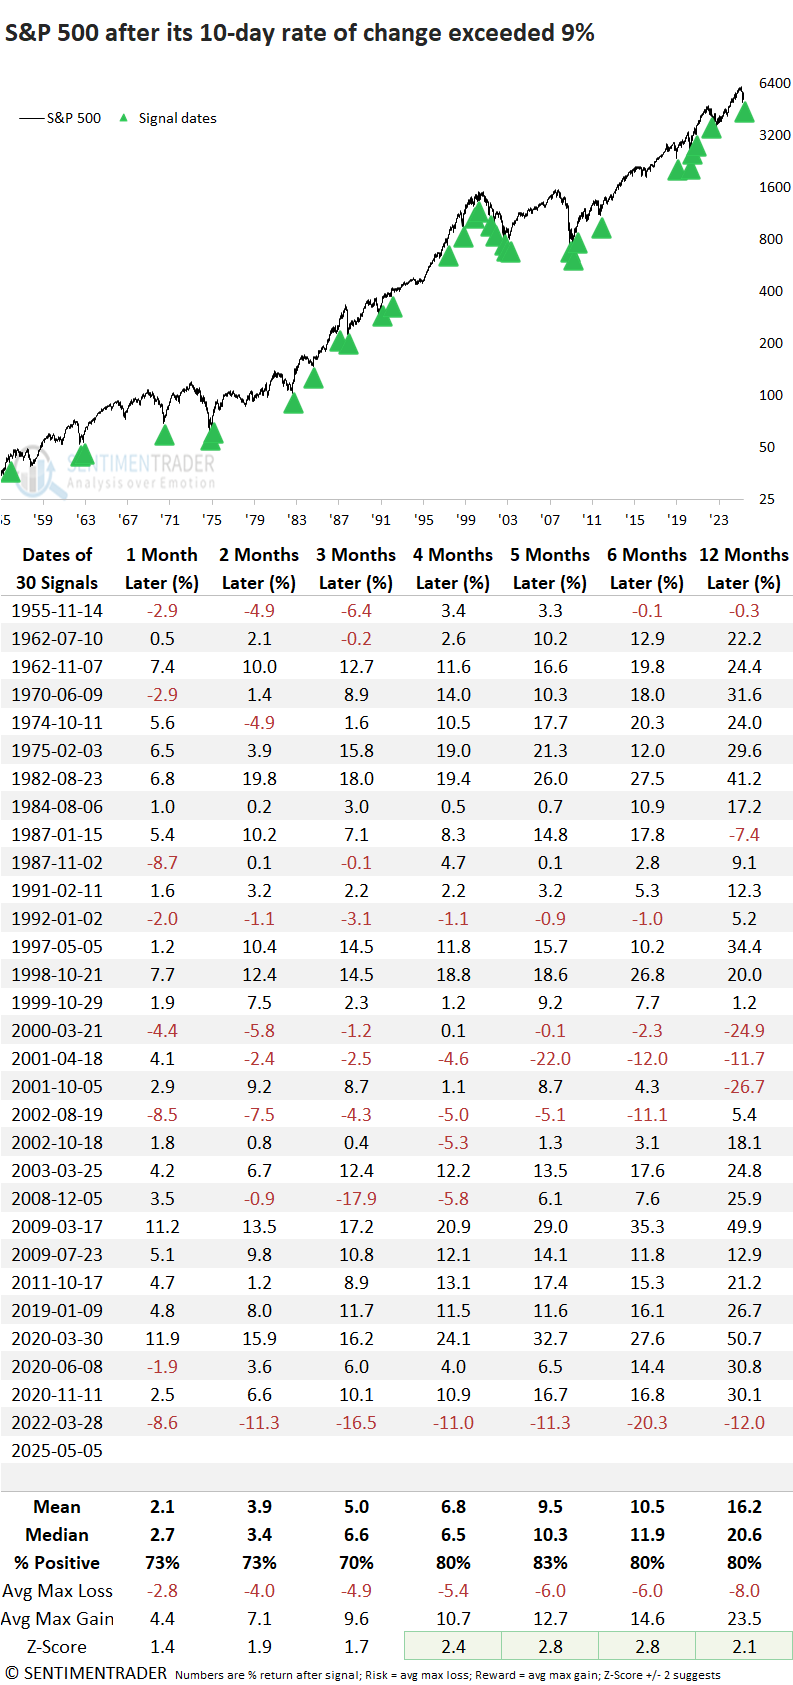
- Similar price momentum thrusts saw the S&P 500 rally, especially after the 1929-42 secular bear
- The TCTM Composite Thrust Model signal count increased to 10%
Positive momentum tends to beget more positive momentum
Although breadth-based measures remain my preferred indicator for identifying thrusts, it's essential to incorporate a variety of approaches since no single tool is foolproof. One of the most straightforward alternatives is analyzing price momentum or rate of change. Similar to breadth thrusts, when price velocity increases over a brief period, it tends to persist over longer horizons, albeit at a slower pace.
A TCTM Composite Thrust Model component triggered an alert when the S&P 500 advanced 9% over ten trading sessions. With the new alert, the composite signal count as a percentage of components increased to 10%, well below the 50% threshold needed to activate a broad composite signal.
Similar thrusts preceded a favorable outlook for stocks
Significant bursts in price momentum over ten days resulted in upside follow-through for the world's most benchmarked index, although it was not overwhelmingly positive. The uninspiring results were primarily due to precedents during the 1929-42 secular bear market. In the following decades, similar momentum has been a much more reliable indication of further upside and often marked a turning point after major market lows.
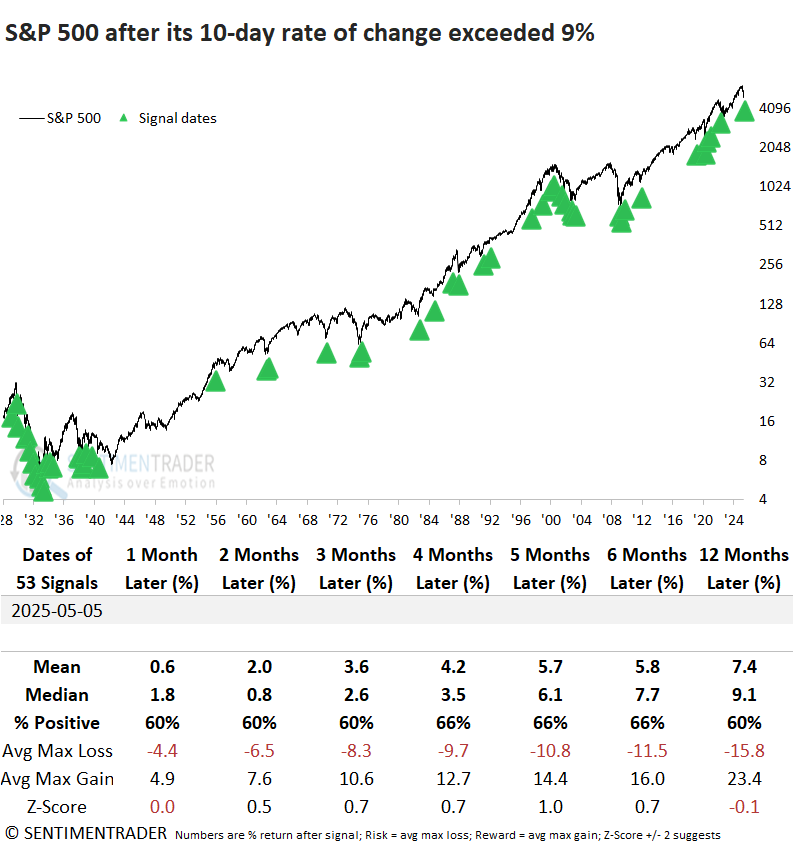
Signals following the 1929-1942 period delivered strong returns and consistent performance across multiple time horizons, often exceeding random expectations. Still, the 2022 example serves as a cautionary note that sharp rallies, such as the recent one, can occur within a bear market.
Something to ponder
A lingering worry is that the market hasn't followed the usual post-correction or bear market script. Usually, my TCTM composite washout model would fire an alert, followed by a thrust signal. Neither has happened so far, which makes me question whether we're headed for a retest, like what occurred in 2015-16, despite other favorable signals like the Zweig thrust.
Remember, keeping an open mind to all possible outcomes is imperative.
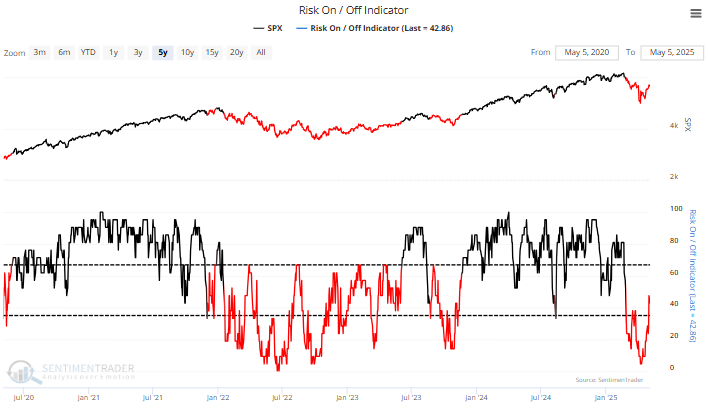
The Risk On/Off indicator, which aggregates 21 breadth and sentiment inputs, has advanced to 43%. Despite the rise, it remains significantly below the 67% mark that historically indicates a transition to a risk-on environment. Notably, this same level acted as resistance during the 2022 bear market.
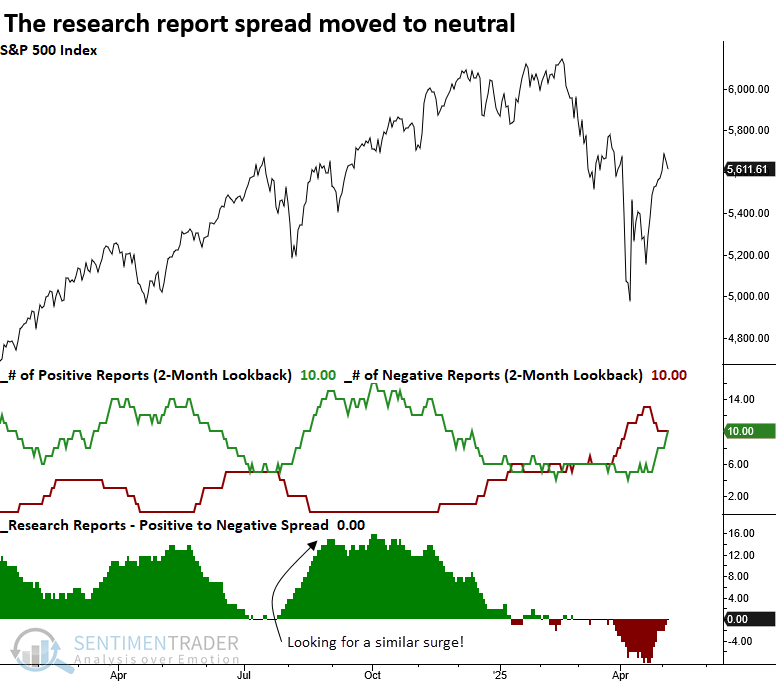
With an uptick in bullish signals of late, the spread between positive and negative research reports has narrowed to zero. However, in a bullish backdrop, the spread should shift significantly in favor of positive studies, similar to August 2024.
What the research tells us...
A TCTM Composite Thrust Model component triggered a new alert after the S&P 500 surged 9% over a ten-day span, reflecting a rare burst of upside momentum. Historically, similar thrusts have preceded sustained gains in the index, suggesting a shift toward a more constructive trend environment. Despite the significance of this move, the overall composite signal count only increased to 10%, which remains well below the 50% threshold required to generate a broad-based alert. This indicates that while pockets of thrust are emerging, the broader market has yet to exhibit the uniform strength typically associated with a more durable bullish phase.