Products
SentimenTrader Trading Tools
‍
Backtest Engine
My Trading Toolkit
Correlation Analysis
Seasonality
Market Prediction
Indicators & Data API
‍
Proprietary Indicators & Charts
Market Data API
Strategies & Scanner
‍
50+ Trading Strategies
Smart Stock Scanner
Smart Option Scanner
Research Reports
‍
Research Solutions
Reports Library
Free Resources
Simple Backtest Calculator
Simple Seasonality Calculator
The Kelly Criterion Calculator
Sentiment Geo Map
Public Research Reports
Education
Sentiment Indicators
Technical Indicators
Pricing
Company
About
In the News
Testimonials
Client Success Stories
Contact
Log inLoginSign up
< BACK TO ALL REPORTS

A Tale Of 2 Sectors

Jason Goepfert
2019-06-14
null

A tale of two sectors

Most utility stocks have been rising over the past 3 weeks and are trading above their 50-day averages. Few energy stocks can boast the same.

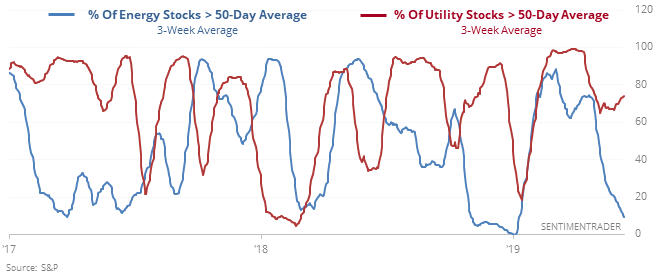
When there has been this wide of a divergence between those two sectors, the broader market had a strong tendency to rise with only one (small) loss over the next 3 months.

Utility stocks tended to perform better than energy stocks going forward, suggesting there wasn’t much of a mean-reversion thing going on.

A terrible few weeks

Oil got slammed by more than 2.5% on 6 of the last 15 sessions, sliding to a multi-month low. That has led to mixed returns for energy stocks over the shorter-term, but the S&P energy sector was higher every time over the next 6 months.

Good liquidity

The NYSE Cumulative Advance/Decline Line rose enough to set a 52-week high on Thursday, leading the S&P 500 and other major indexes.

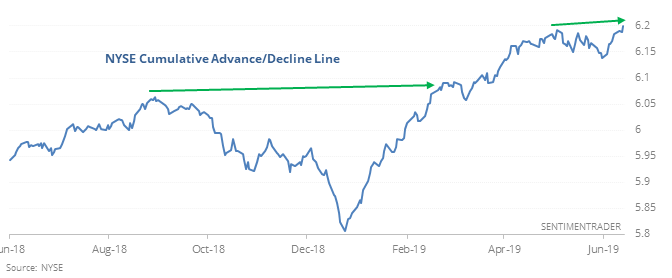
When it did so, the S&P usually set a new high within a month or two (it took an average of 34 trading days), and future drawdowns tended to be limited relative to maximum gains.

Still negative

The AAII Bull Ratio has been below 45% for 5 straight weeks, adding to their streak, the longest stretch since February 2016. The 5-week average is now 40.1%. Per the Backtest Engine, a 5-week Bull Ratio this low during a bull market environment preceded gains in the S&P 500 over the next 3 months after 64 out of 64 times.

This post was an abridged version of our previous day's Daily Report. For full access, sign up for a 30-day free trial now.

PRODUCTS
SentimenTrader
Trading Tools
Indicators & Data API
‍
Strategies & Scanner
‍
Research Reports
FREE
RESOUrCES
Simple Backtest
Calculator
Simple Seasonality
Calculator
The Kelly Criterion
Calculator
Sentiment Geo Map
‍
Public Research Reports
‍
Education
Sentiment Indicators
‍
Technical Indicators
‍
Pricing
Bundle pricing
‍
FAQ
‍
Announcements
‍
COMPANY
‍
About
‍
In the News
‍
Testimonials
‍
Client Success Stories
CONTACT
‍
General Inquiries
‍
Media Inquiries
‍
Financial Professionals Inquiries
‍
© 2026 Sundial Capital Research Inc. All rights reserved.
Setsail Marketing
TermsPrivacyAffiliate Program
Risk Disclosure: The information and tools provided are for research and analytical purposes only and are not intended as investment advice. Market analysis involves uncertainty, and outcomes may differ from expectations. Users should conduct their own due diligence and consider their individual circumstances before making any financial decisions. Past performance is not necessarily indicative of future results.

Hypothetical Performance Disclosure: Hypothetical performance results have many inherent limitations, some of which are described below. No representation is being made that any account will or is likely to achieve profits or losses similar to those shown; in fact, there are frequently sharp differences between hypothetical performance results and the actual results subsequently achieved by any particular trading program. One of the limitations of hypothetical performance results is that they are generally prepared with the benefit of hindsight. In addition, hypothetical trading does not involve financial risk, and no hypothetical trading record can completely account for the impact of financial risk of actual trading. for example, the ability to withstand losses or to adhere to a particular trading program in spite of trading losses are material points which can also adversely affect actual trading results. There are numerous other factors related to the markets in general or to the implementation of any specific trading program which cannot be fully accounted for in the preparation of hypothetical performance results and all which can adversely affect trading results.

Testimonial Disclosure: Testimonials appearing on this website may not be representative of other clients or customers and is not a guarantee of future performance or success.