Products
SentimenTrader Trading Tools
‍
Backtest Engine
My Trading Toolkit
Correlation Analysis
Seasonality
Market Prediction
Indicators & Data API
‍
Proprietary Indicators & Charts
Market Data API
Strategies & Scanner
‍
50+ Trading Strategies
Smart Stock Scanner
Smart Option Scanner
Research Reports
‍
Research Solutions
Reports Library
Free Resources
Simple Backtest Calculator
Simple Seasonality Calculator
The Kelly Criterion Calculator
Sentiment Geo Map
Public Research Reports
Education
Sentiment Indicators
Technical Indicators
Pricing
Company
About
In the News
Testimonials
Client Success Stories
Contact
Log inLoginSign up
< BACK TO ALL REPORTS

A systematic approach to a simple S&P 500 momentum signal

Jay Kaeppel
2024-03-28
The S&P 500 Index is poised to close higher for the fifth consecutive month. Historically, this has tended to be followed by continued momentum. Herein, we provide details of a simple way to take advantage of the situation.

Key points

  • The S&P 500 is poised to close the month of March with a higher close for the fifth consecutive month
  • Historically, this has been a favorable momentum signal for the broader stock market
  • In this piece, we apply a few simple rules to utilize this signal in a systematic manner

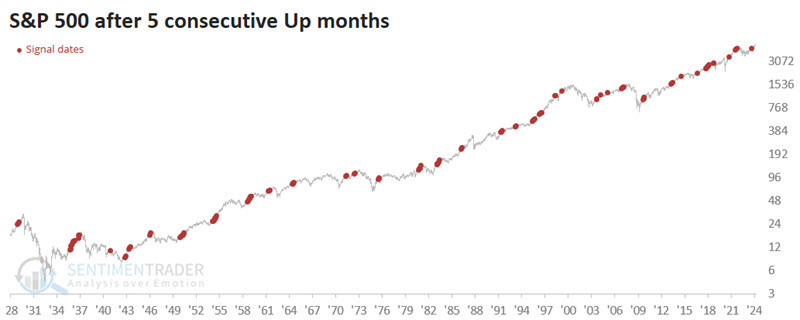
Five consecutive up months for the S&P 500 Index

The S&P 500 Index is poised to close the month of March with its fifth consecutive higher monthly close. If we consider overlapping readings, this has happened 118 times since 1922.

While we don't advocate using this as a standalone trading model, it is interesting to consider the results if we apply systematic rules.

A systematic approach to "5 Up Months."

The trading rules are simple:

  • If the S&P 500 closes higher for five straight months, we buy and hold the index for nine months
  • If a new signal* occurs within the initial nine months, we extend the holding period another nine months

*Note that if the S&P 500 closes higher, for example, eight months in a row, each new higher close after the initial five-month signal constitutes a "new signal." To spell it out:

  • If January through May all closed higher, we would start a nine-month holding period from June through February the following year. If the S&P 500 also closes higher in June, we extend the holding period another month to the end of March of next year, and so on.

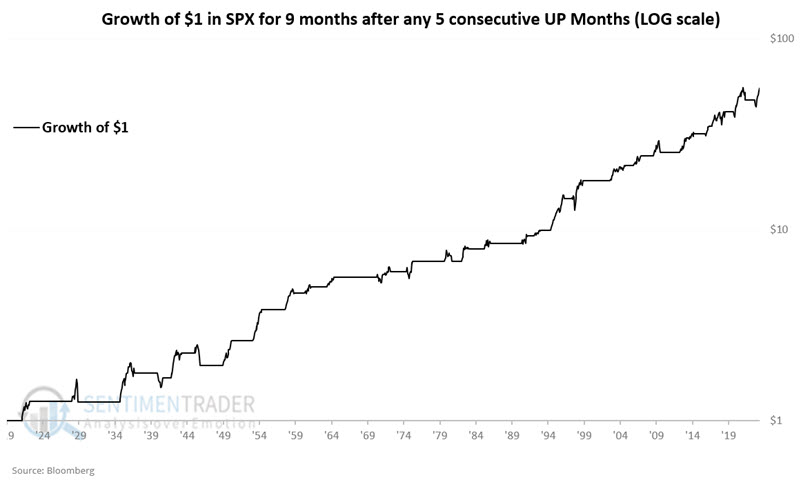
The chart below displays the hypothetical equity curve (using month-end closing prices) for the "strategy" (such as it is) above.

The table below displays trade-by-trade results.

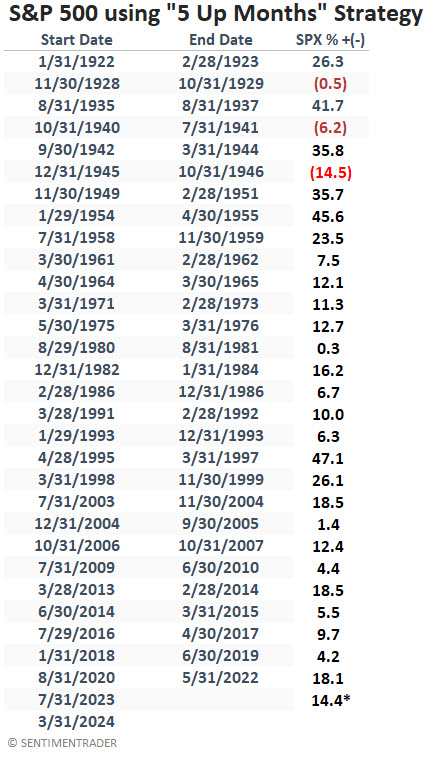
* - SPX up 14.4% from 2023-07-31 through 2024-03-26.

The table below summarizes the results.

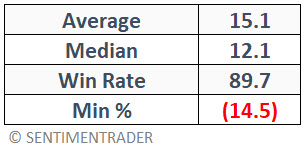
Key things to note include an 89.7$% Win Rate and the fact that the method has not shown a loss since 1945-46. That said, nothing is ever guaranteed to work ad infinitum into the future, and momentum is only one factor in the market.

What the research tells us…

History has long demonstrated that momentum is one of the most critical factors in the stock market. This study is not the "definitive" approach to momentum investing. It is merely just one more brick in the wall. The bottom line is that while investors must always remain vigilant about managing risk, studies like this remind us to give the bullish case the benefit of the doubt (and to ignore subjectively bearish narratives) until the market itself tells us otherwise.

PRODUCTS
SentimenTrader
Trading Tools
Indicators & Data API
‍
Strategies & Scanner
‍
Research Reports
FREE
RESOUrCES
Simple Backtest
Calculator
Simple Seasonality
Calculator
The Kelly Criterion
Calculator
Sentiment Geo Map
‍
Public Research Reports
‍
Education
Sentiment Indicators
‍
Technical Indicators
‍
Pricing
Bundle pricing
‍
FAQ
‍
Announcements
‍
COMPANY
‍
About
‍
In the News
‍
Testimonials
‍
Client Success Stories
CONTACT
‍
General Inquiries
‍
Media Inquiries
‍
Financial Professionals Inquiries
‍
© 2026 Sundial Capital Research Inc. All rights reserved.
Setsail Marketing
TermsPrivacyAffiliate Program
Risk Disclosure: The information and tools provided are for research and analytical purposes only and are not intended as investment advice. Market analysis involves uncertainty, and outcomes may differ from expectations. Users should conduct their own due diligence and consider their individual circumstances before making any financial decisions. Past performance is not necessarily indicative of future results.

Hypothetical Performance Disclosure: Hypothetical performance results have many inherent limitations, some of which are described below. No representation is being made that any account will or is likely to achieve profits or losses similar to those shown; in fact, there are frequently sharp differences between hypothetical performance results and the actual results subsequently achieved by any particular trading program. One of the limitations of hypothetical performance results is that they are generally prepared with the benefit of hindsight. In addition, hypothetical trading does not involve financial risk, and no hypothetical trading record can completely account for the impact of financial risk of actual trading. for example, the ability to withstand losses or to adhere to a particular trading program in spite of trading losses are material points which can also adversely affect actual trading results. There are numerous other factors related to the markets in general or to the implementation of any specific trading program which cannot be fully accounted for in the preparation of hypothetical performance results and all which can adversely affect trading results.

Testimonial Disclosure: Testimonials appearing on this website may not be representative of other clients or customers and is not a guarantee of future performance or success.