
A swing trading system triggered a buy signal for Bitcoin

Key points:
- A swing trading system that uses short-term trend-following indicators triggered a buy signal for Bitcoin
- Following similar composite thrusts, Bitcoin rallied 89% of the time over the subsequent two weeks
- When Bitcoin exhibits a bullish trend shift, the S&P 500 rallied 89% of the time over the ensuing month
A potential upside resolution to a bullish flag formation in Bitcoin
Since reaching its low point in the fall of 2022, Bitcoin has mirrored the behavior of stocks by steadily climbing in a bullish uptrend. It has paused periodically throughout this period to digest its gains, with the latest consolidation phase beginning in March, forming what is known as a bull flag.
This formation occurs following a strong upward price movement and is considered a continuation pattern. It typically resolves in the direction of the previous trend.
A swing trading system that utilizes a composite comprised of short-term trend-following indicators triggered a buy signal when the week-over-week change shifted upward by ten points, suggesting favorable odds for a bull flag breakout.
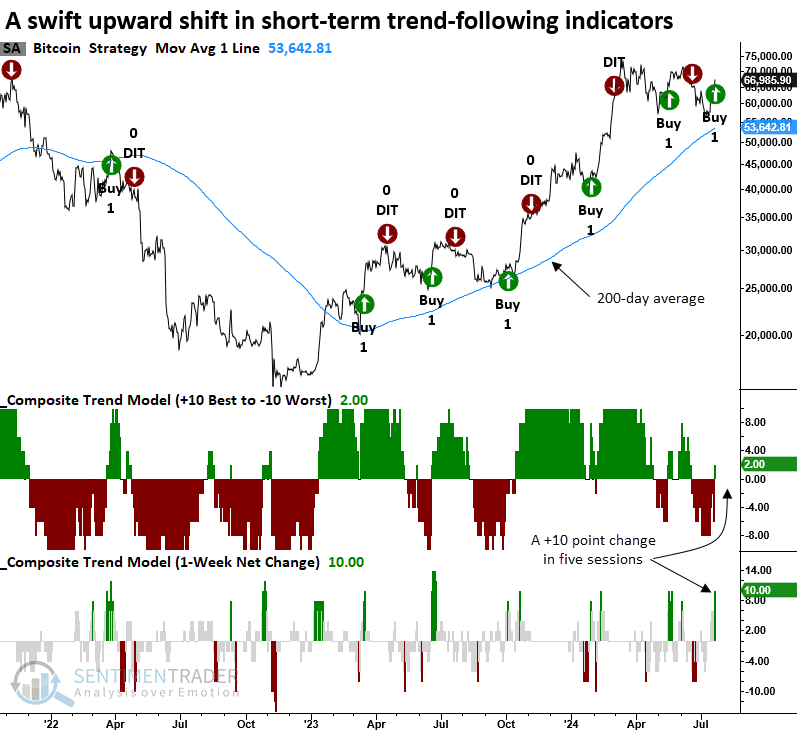
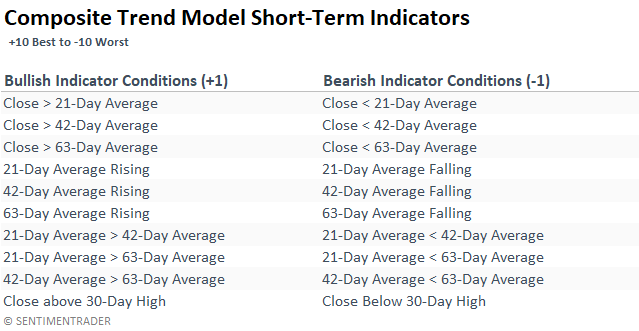
In previous research notes, I shared my composite trend model, which incorporates ten trend-following indicators with medium-to long-term durations. Although this composite is superb for evaluating big-picture trends, it's not as timely for trading ideas. Therefore, I shortened the indicator durations to develop a more robust swing trading strategy.
The following table contains the composite conditions and indicator durations.
Comparable thrusts preceded near-term upside follow-through
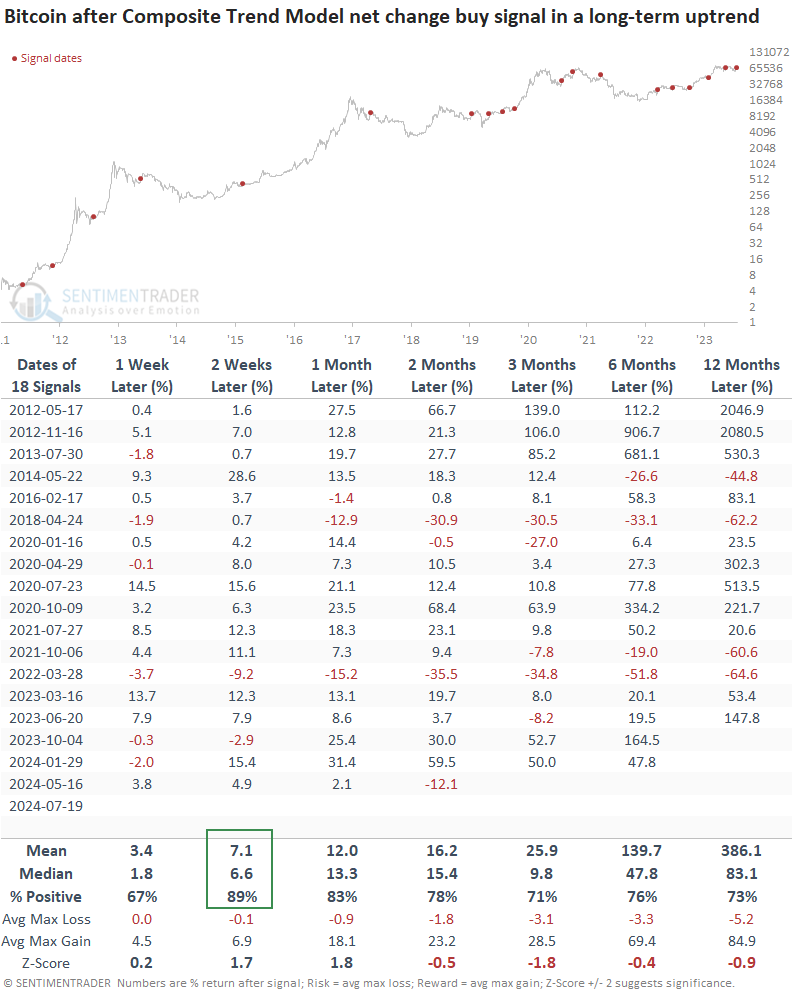
Whenever the composite trend model shifted upward by eight points or more in five days, and Bitcoin was trading above its 200-day average, the bullish price momentum in the cryptocurrency was likely to persist, with the asset rising 89% of the time over the following two weeks. While none of the time frames exhibited significance relative to random returns, the two and four-week horizons were close.
The previous signal, which occurred within the context of the current bull flag, gained 9% before rolling over and registering a loss at the two-month mark, providing an excellent example of why prudent risk management that employs profit targets and stops is imperative, especially for a volatile asset like Bitcoin.
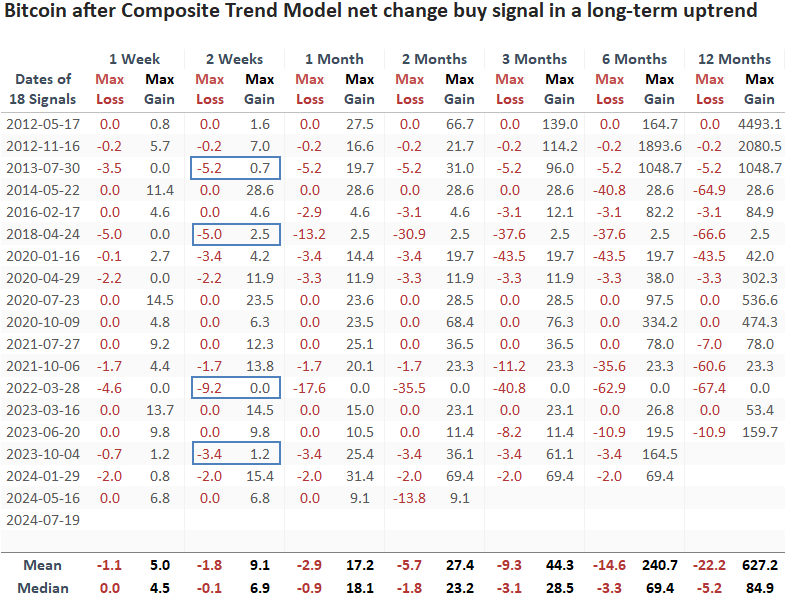
Over two weeks, the maximum gain exceeded the maximum loss in 14 out of 18 instances. Furthermore, the maximum loss never exceeded -10%.
What about other risk assets like stocks?
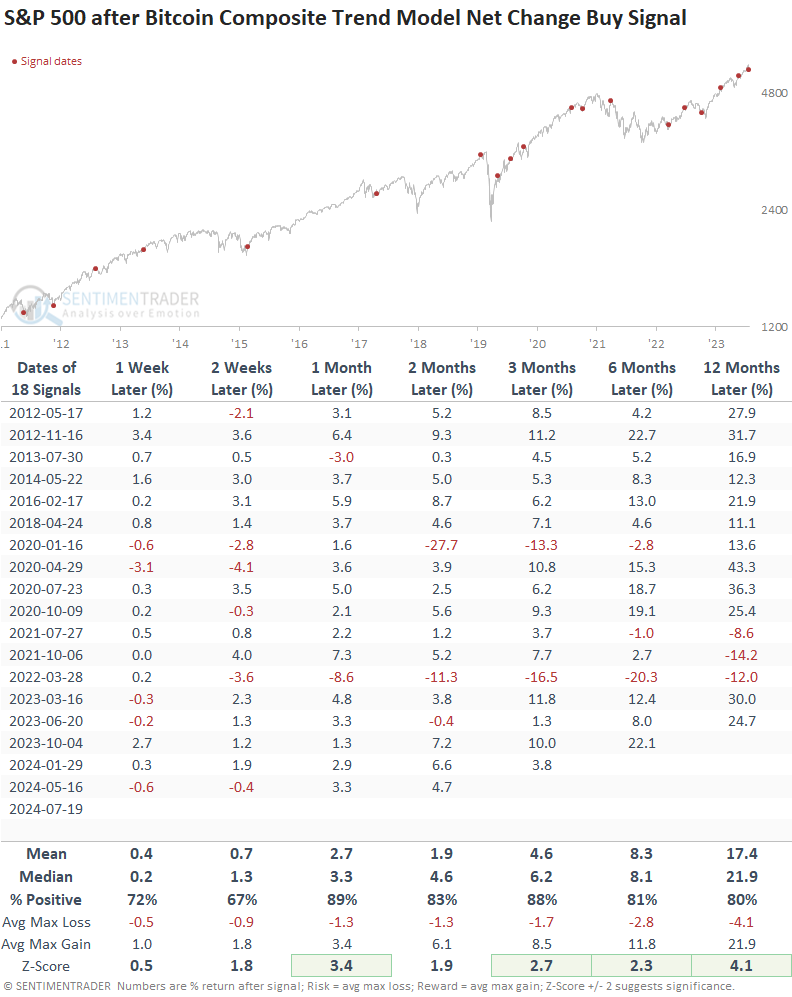
Suppose I apply the signals to the S&P 500. In that case, periods when Bitcoin exhibited a bullish upward shift in a composite trend model generally coincided with a favorable backdrop for the S&P 500.
Over the following month, the world's most benchmarked index rallied 89% of the time.
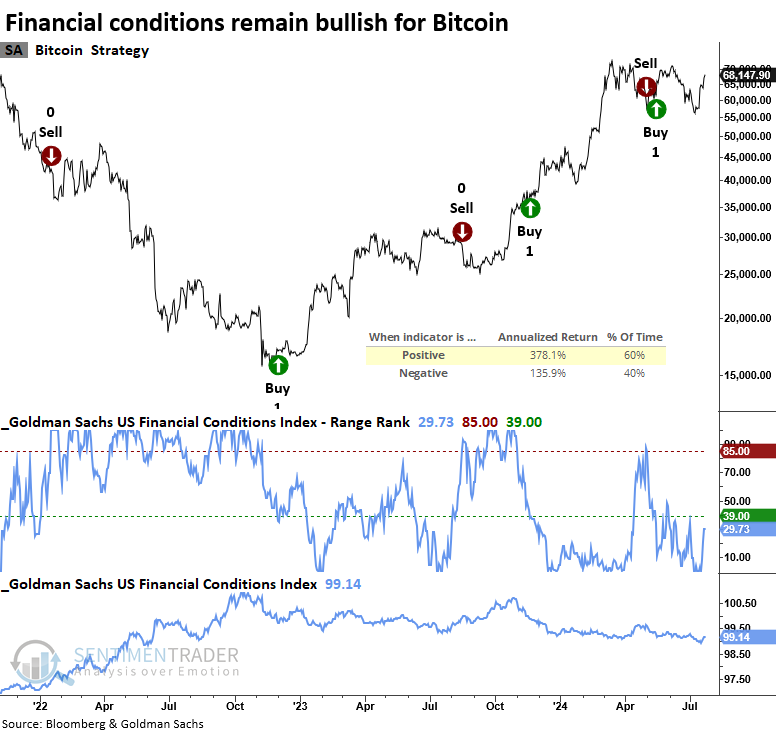
A bullish backdrop
While I initially created my financial conditions model for stocks, it can be applied to other risk assets like Bitcoin. When the model maintains a positive stance, like now, Bitcoin produces an annualized return of 378%, far outpacing the return when conditions are negative.
What the research tells us...
A swing trading system that uses short-term trend-following indicators in a composite model shifted higher, triggering a buy signal for Bitcoin. With the cryptocurrency in a bull flag formation, the potential for an upside resolution to this continuation pattern looks compelling. Following similar signals, Bitcoin rose 89% of the time over the subsequent two weeks. When the cryptocurrency exhibited positive momentum, it was generally a good sign for other risk assets like stocks.