
A swift reversal in uptrends suggests higher stock prices

Key points:
- The number of S&P 500 members with a rising 200-day average cycled from > 80% to < 50%
- The shift from > 80% to < 30% occurred in 27 sessions and within 3-months of a multi-year high
- Similar signals preceded positive returns 83% of the time 2 months later
A swift reversal in the number of stocks in a long-term uptrend
The percentage of members with a rising 200-day moving average provides a big-picture assessment of individual stock trends within an index. This time series has a higher hurdle rate than the standard percentage above the 200-day series. i.e., it requires more time below the average to shift the slope from positive to negative.
Let's conduct a study to assess the outlook for the stocks when the number of S&P 500 members with a rising 200-day moving average reverses from > 80% to < 50% in 30 days or less. I will also require the reversal to occur within 65 days of a multi-year high to identify instances similar to the current one.
Edit: I used an additional condition that required the series to cross above 90% before a new signal could trigger again. i.e., the first instance.
A swift reversal in long-term uptrends last occurred in 2014. Interestingly, that was when energy and other resource-based stocks drove the big picture internal trend change-the opposite of today's environment.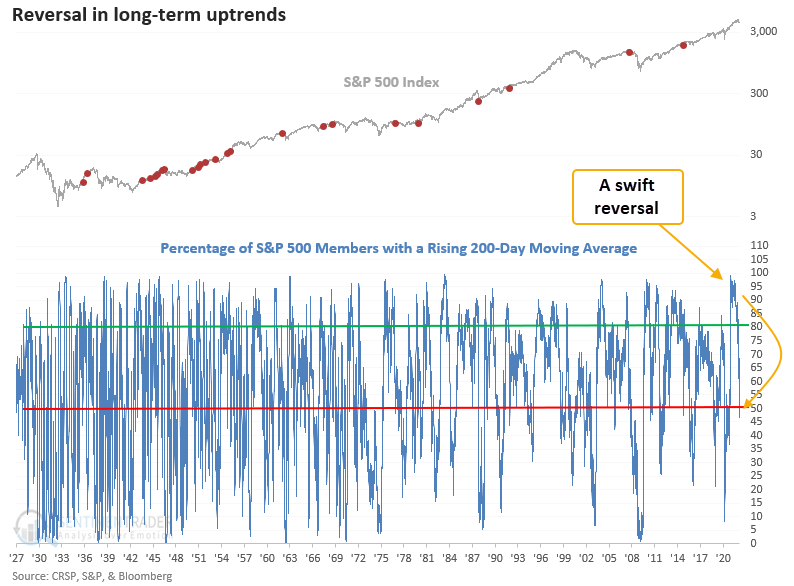
Similar signals preceded gains 83% of the time
This signal triggered 24 other times over the past 87 years. After the others, S&P 500 future returns, win rates, and risk/reward profiles were excellent across all time frames, especially the 2-month window. Drawdowns were minimal in the first 2 months, with only one instance greater than 10%. Suppose we review the signals that eventually led to a bear market like 1946, 1962, and 2007. In that case, the table shows a positive return at some point in the first month in all three instances.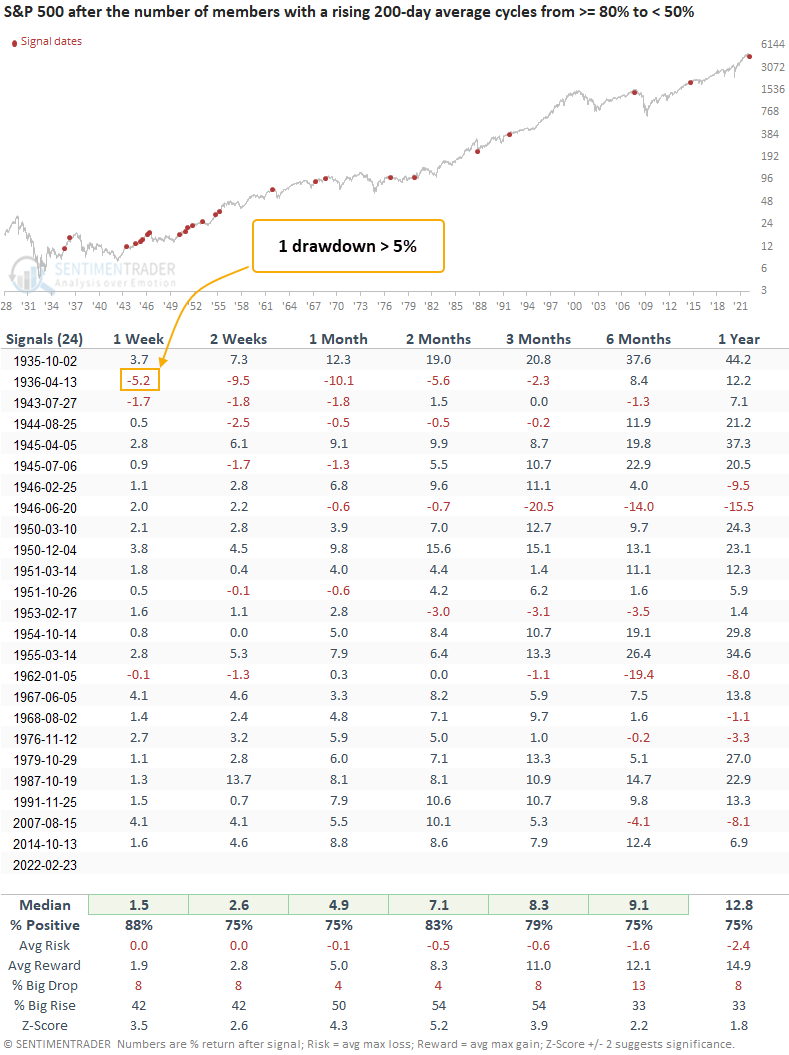
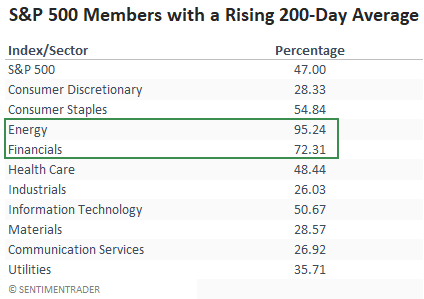
A breakout by sector shows strength in value-oriented groups
Energy and financials show healthy long-term trends for individual member stocks on an absolute and relative basis. Financials are the most interesting group as they typically show weak trends around bear market peaks. The current strength would suggest a growth scare or Fed-induced policy correction rather than a bear market accompanied by a recession.
What the research tells us...
The swift reversal in long-term uptrends near a multi-year high suggests stocks can revert higher. Similar setups to what we're seeing now have preceded excellent returns, win rates, and risk/reward profiles, especially on a 2-month basis.
Several market headwinds like Russia/Ukraine and Fed policy continue to linger. I'm also somewhat concerned by the inability of the market to get severely oversold. The problem with the significant reversals that occurred on 1/24 and 2/24 is that it lifts breadth series off low levels. i.e., it delays the inevitable capitulation event. In a note last week, I shared my composite washout model. The signal count remains below the ideal threshold level for a signal. Until we see a washout event and subsequent breadth thrusts signals, the risk/reward profile for the market remains challenging.