Products
SentimenTrader Trading Tools
‍
Backtest Engine
My Trading Toolkit
Correlation Analysis
Seasonality
Market Prediction
Indicators & Data API
‍
Proprietary Indicators & Charts
Market Data API
Strategies & Scanner
‍
50+ Trading Strategies
Smart Stock Scanner
Smart Option Scanner
Research Reports
‍
Research Solutions
Reports Library
Free Resources
Simple Backtest Calculator
Simple Seasonality Calculator
The Kelly Criterion Calculator
Sentiment Geo Map
Public Research Reports
Education
Sentiment Indicators
Technical Indicators
Pricing
Company
About
In the News
Testimonials
Client Success Stories
Contact
Log inLoginSign up
< BACK TO ALL REPORTS

A swift reversal in the price of the S&P 500

Dean Christians
2022-08-30
The S&P 500 reversed from a 42-day high to a 21-day low in eight sessions. The price setback occurred within the context of an established long-term downtrend. Using history as a guide, let's assess the outlook for the world's most watched benchmark after similar reversals.

Key points:

  • The S&P 500 closed at its first 21-day low after closing at a 42-day high
  • The reversal occurred in eight sessions and within the context of a long-term downtrend
  • After similar setbacks, the S&P 500 showed negative returns across all time frames

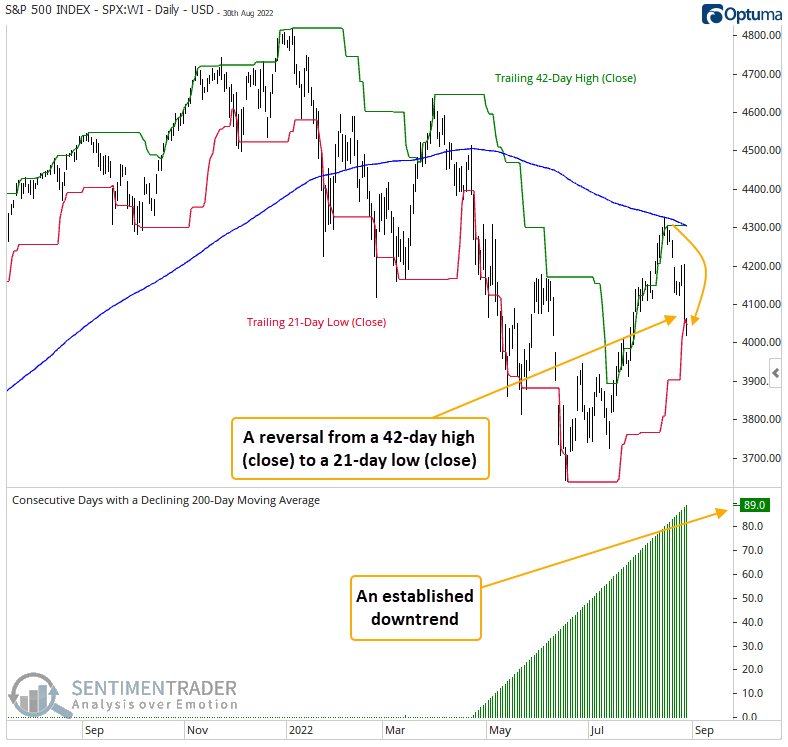
A price reversal in an established downtrend

The S&P 500 and other indexes continue to retrace the multi-month surge from the June low. The world's most watched benchmark reversed from a 42-day high (close) to a 21-day low (close) in only eight sessions.

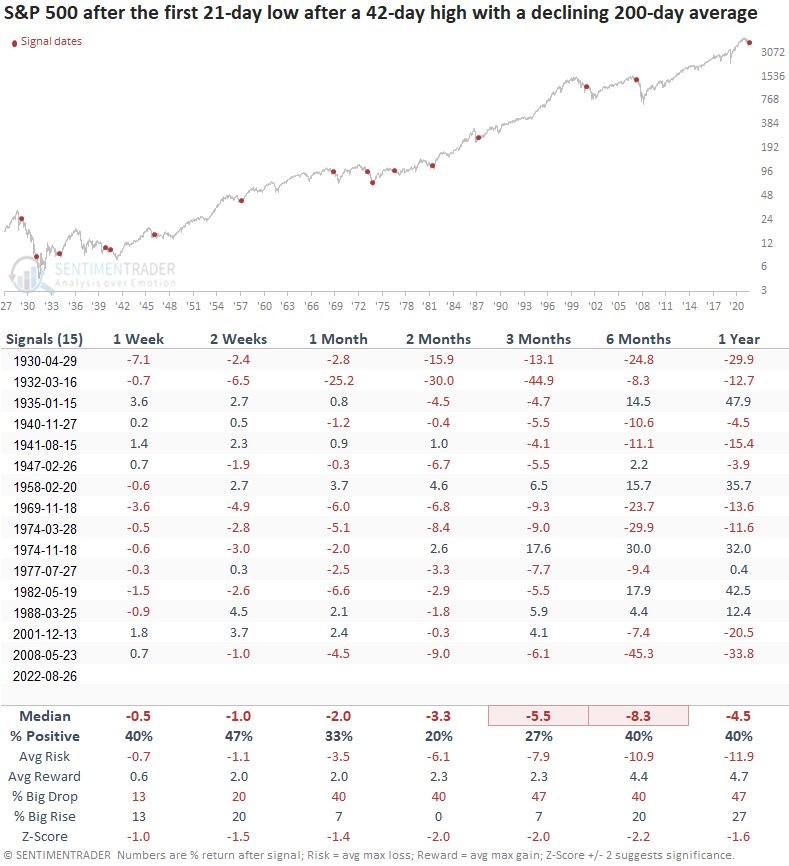
Let's assess the S&P 500 outlook when the index reverses from a 42-day high (close) to a 21-day low (close) in 15 or fewer sessions. At the same time, the index must be below its 200-day moving average, and the average has declined for at least 80 consecutive days. I increased the reversal count and lowered the successive days below the average to give us a larger sample size.

Similar reversal patterns in a downtrend preceded negative returns

A swift reversal from a 42-day high (close) to a 21-day low (close) within an established downtrend typically occurs in significant bear markets. 1962 and 1966 are notable exceptions. In most cases, the S&P 500 closed at a lower low. Signals in 1958, November 1974, and 1988 are instances when the index failed to take out the previous low.  

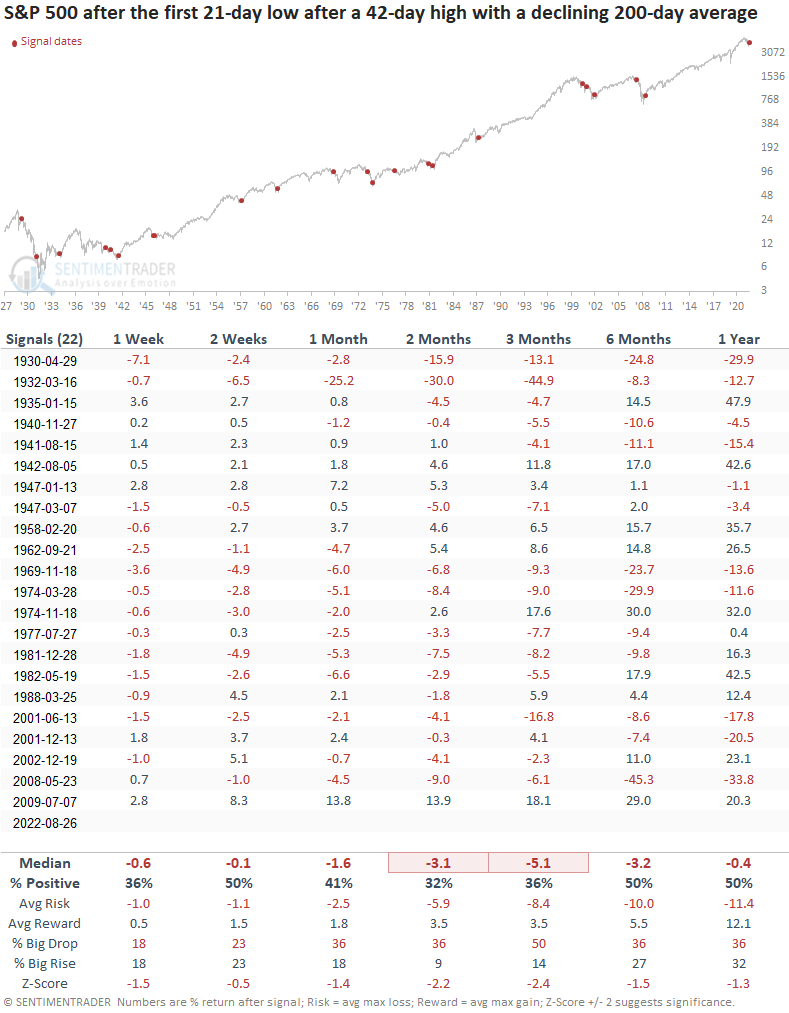
The study shows seven additional signals if I increase the reversal count from 15 to 25 sessions. Returns, win rates, and z-scores continue to look unfavorable. The relaxed condition parameter picked up a signal in 1962, which happens to be another example of a significant retracement, but not an undercut of the low. 

What the research tells us...

The swift reversal in the price of the S&P 500 index from a 42-day high (close) to a 21-day low (close) in an established downtrend doesn't bode well for the bulls in the next few months. One cannot rule out a significant retracement or an undercut of the June low. If the S&P 500 closes at a lower low, I want to see a divergence in new lows, which was absent in June. 

PRODUCTS
SentimenTrader
Trading Tools
Indicators & Data API
‍
Strategies & Scanner
‍
Research Reports
FREE
RESOUrCES
Simple Backtest
Calculator
Simple Seasonality
Calculator
The Kelly Criterion
Calculator
Sentiment Geo Map
‍
Public Research Reports
‍
Education
Sentiment Indicators
‍
Technical Indicators
‍
Pricing
Bundle pricing
‍
FAQ
‍
Announcements
‍
COMPANY
‍
About
‍
In the News
‍
Testimonials
‍
Client Success Stories
CONTACT
‍
General Inquiries
‍
Media Inquiries
‍
Financial Professionals Inquiries
‍
© 2026 Sundial Capital Research Inc. All rights reserved.
Setsail Marketing
TermsPrivacyAffiliate Program
Risk Disclosure: The information and tools provided are for research and analytical purposes only and are not intended as investment advice. Market analysis involves uncertainty, and outcomes may differ from expectations. Users should conduct their own due diligence and consider their individual circumstances before making any financial decisions. Past performance is not necessarily indicative of future results.

Hypothetical Performance Disclosure: Hypothetical performance results have many inherent limitations, some of which are described below. No representation is being made that any account will or is likely to achieve profits or losses similar to those shown; in fact, there are frequently sharp differences between hypothetical performance results and the actual results subsequently achieved by any particular trading program. One of the limitations of hypothetical performance results is that they are generally prepared with the benefit of hindsight. In addition, hypothetical trading does not involve financial risk, and no hypothetical trading record can completely account for the impact of financial risk of actual trading. for example, the ability to withstand losses or to adhere to a particular trading program in spite of trading losses are material points which can also adversely affect actual trading results. There are numerous other factors related to the markets in general or to the implementation of any specific trading program which cannot be fully accounted for in the preparation of hypothetical performance results and all which can adversely affect trading results.

Testimonial Disclosure: Testimonials appearing on this website may not be representative of other clients or customers and is not a guarantee of future performance or success.