
A Swift Reversal in the Energy Sector's RSI

Key points:
- The RSI for the Energy (XLE) and Utilities (XLU) sectors recently cycled from less than 26 to greater than 71.
- For XLE, the signal has historically led to a weak short-term outlook, with returns only turning positive at the 1-year mark.
- Adding a 200-day average filter highlights a pocket of strength for XLE at the 6-month mark, but 1-year returns surprisingly weaken.
- The same signal has been more reliably bullish for the Utilities sector (XLU), which shows a 69% win rate over the following year.
A reversal for a widely followed price momentum indicator
The Relative Strength Index (RSI), a well-known price momentum indicator, excels at identifying trends and potential turning points in the market. Traders and analysts value its flexibility, using it as a standalone trading signal, a component of a larger strategy, or as an overlay for other systems.
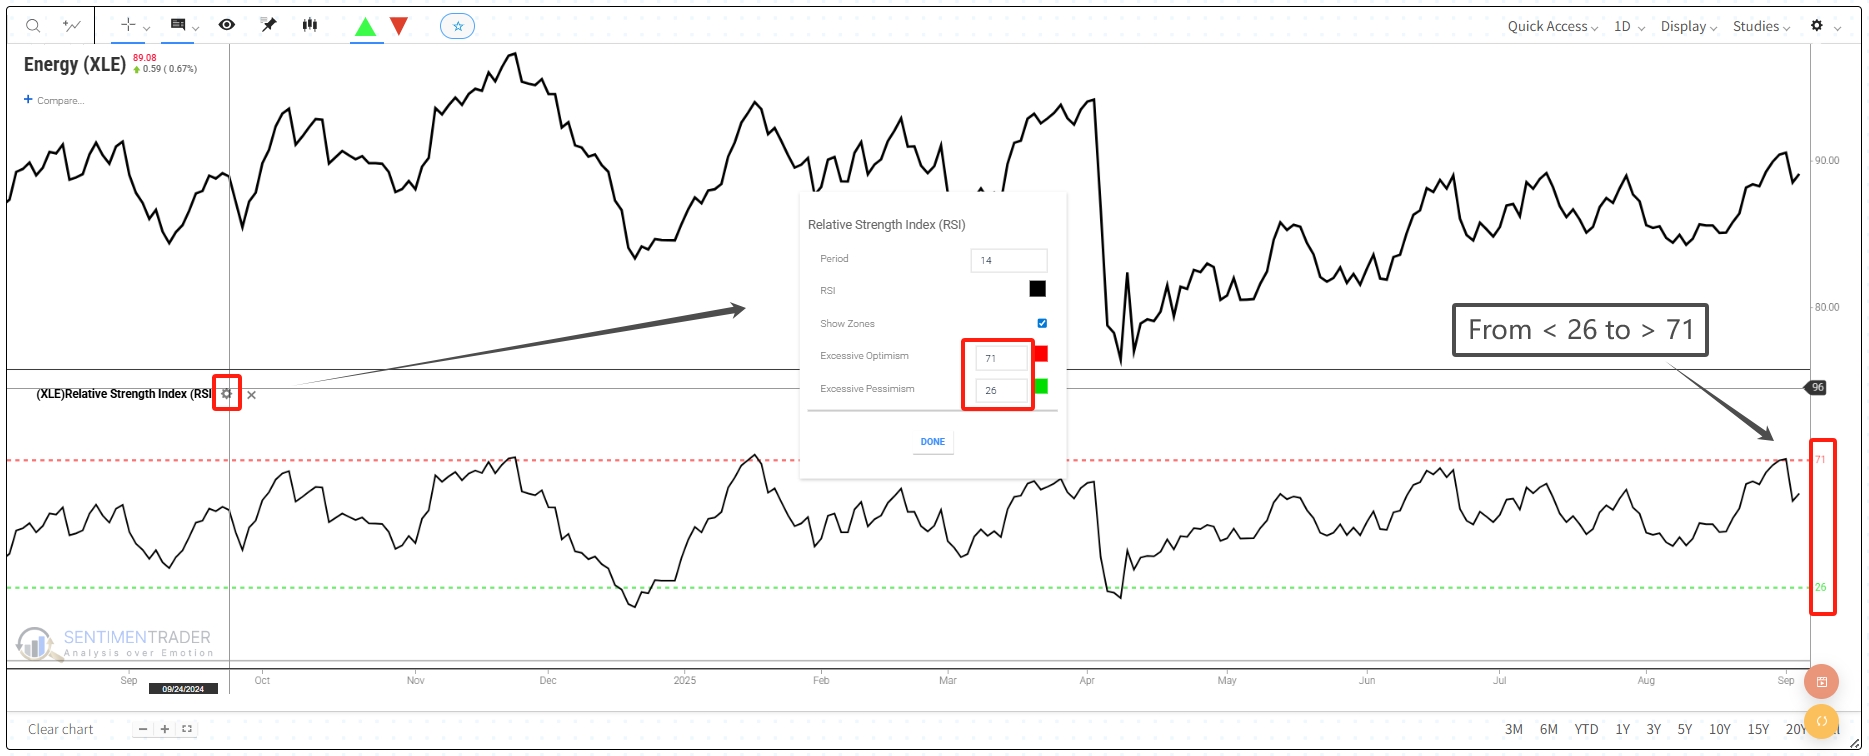
While readings below 30 are typically considered "oversold" and readings above 70 "overbought," some of the most potent signals occur when the indicator travels from one extreme to the other in a short period. Such a move suggests a significant reversal in market sentiment and money flow.
This week, the RSI for the Energy Select Sector SPDR Fund (XLE) provided a textbook example of this phenomenon. The indicator surged from a reading below 26 to a level above 71 on September 4th, 2025. This quick journey from a low reading to strongly overbought territory is an uncommon event that warrants a deeper look into its historical implications. For extreme value settings, please refer to the image below. For related backtest, click here.
Similar price momentum reversals preceded a challenging outlook
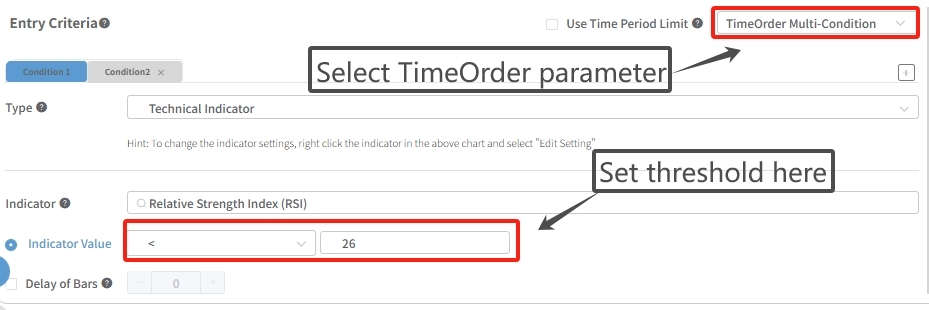
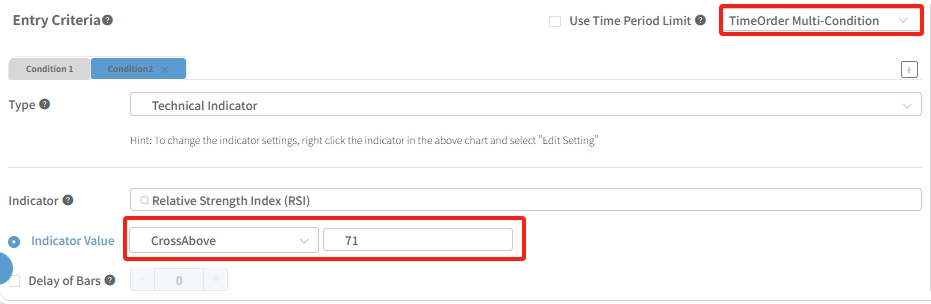
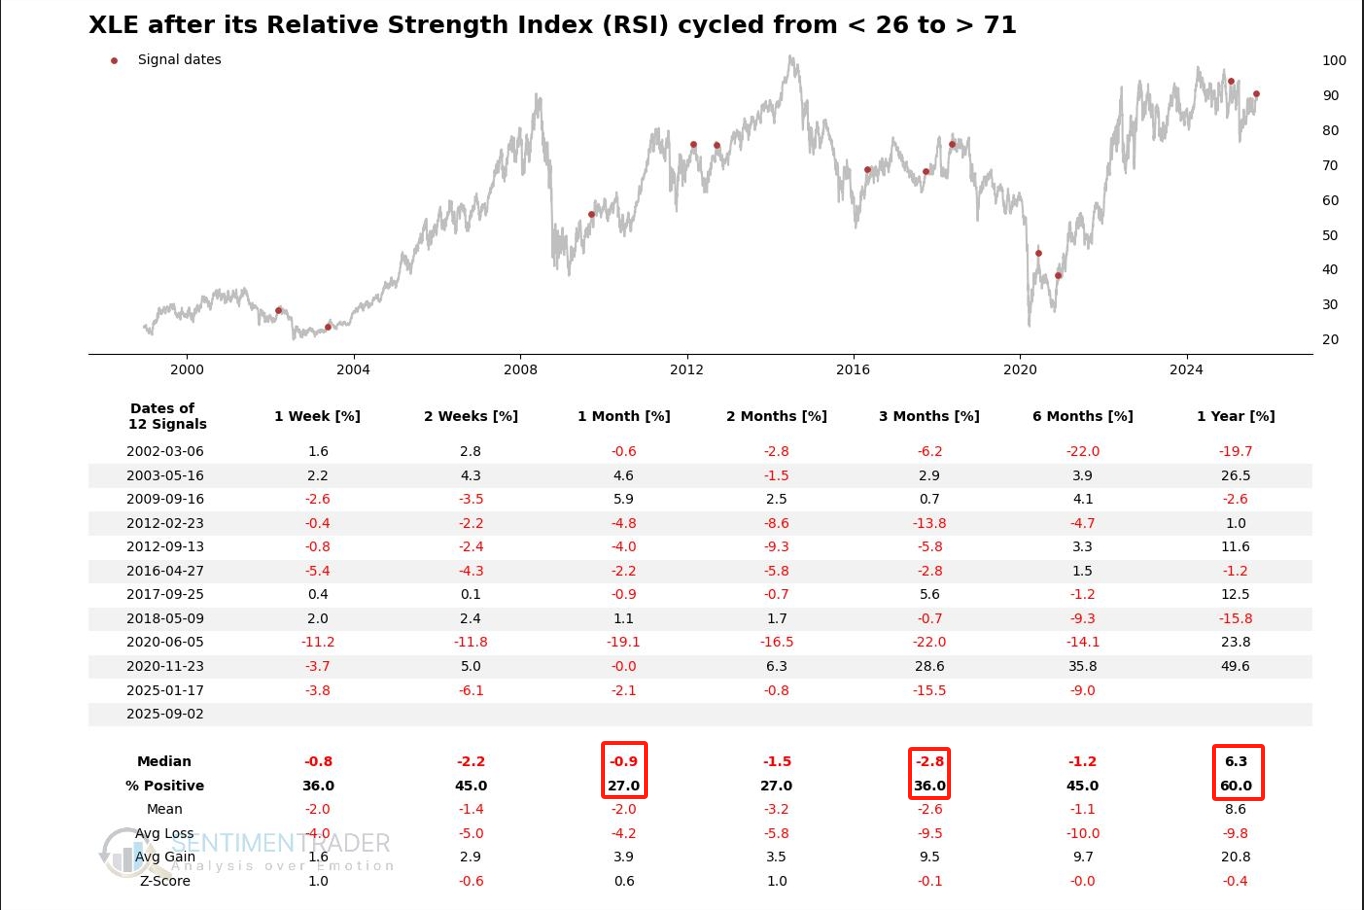
Following instances when the XLE's RSI reversed from below 26 to above 71, the energy sector ETF displayed a surprisingly weak and inconsistent performance, especially in the short-to-medium term. History suggests that while the initial momentum thrust is strong, it often fails to translate into immediate gains. The parameter section and accompanying diagram below highlight the settings within Backtest.
As the table below shows, the results over the next one to three months were notably poor. Over the following month, XLE was positive only 27% of the time, with a median return of -0.9%. The performance was even weaker over the three-month window, which saw a win rate of only 36% and a median loss of -2.8%. With median returns remaining negative across all time frames up to six months, the historical risk/reward profile in the interim appears unfavorable. The outlook becomes more constructive only over a one-year timeframe, which showed a 60% win rate and a solid 6.3% median gain.
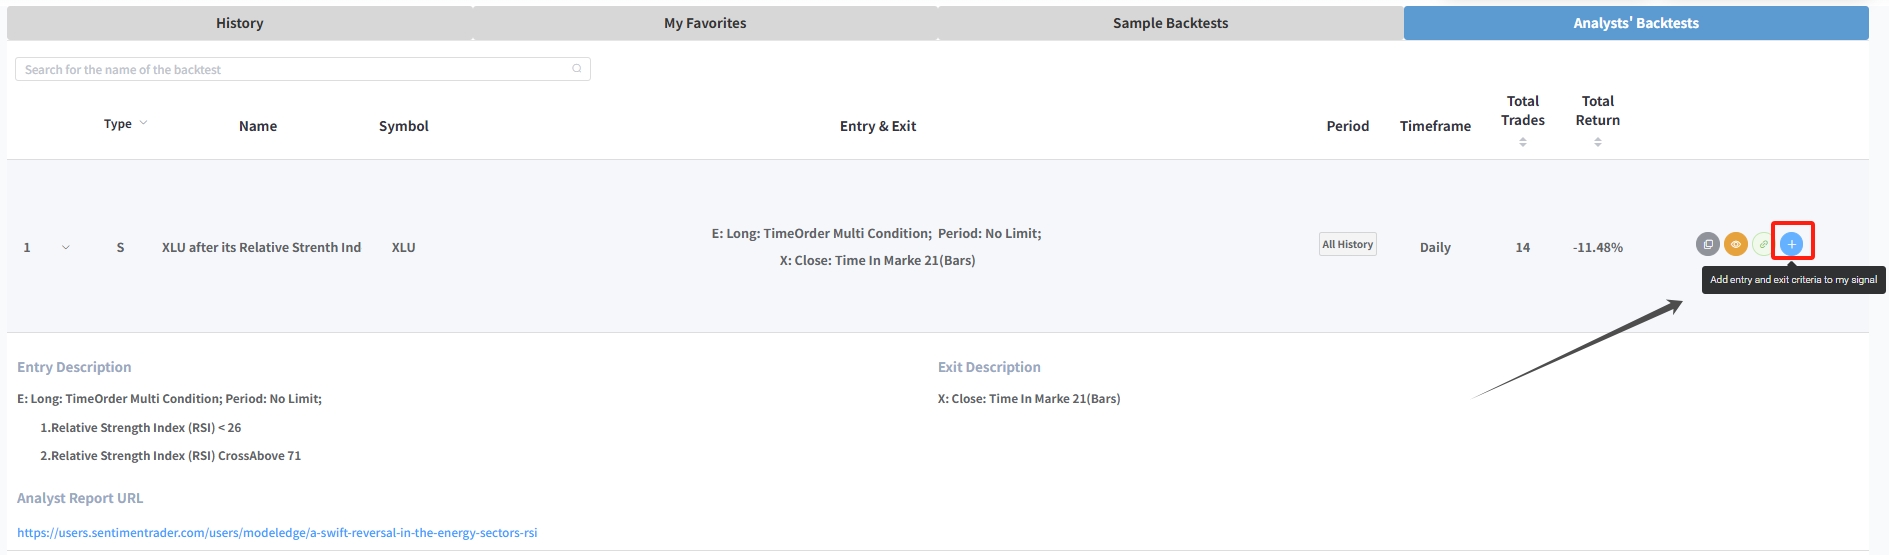
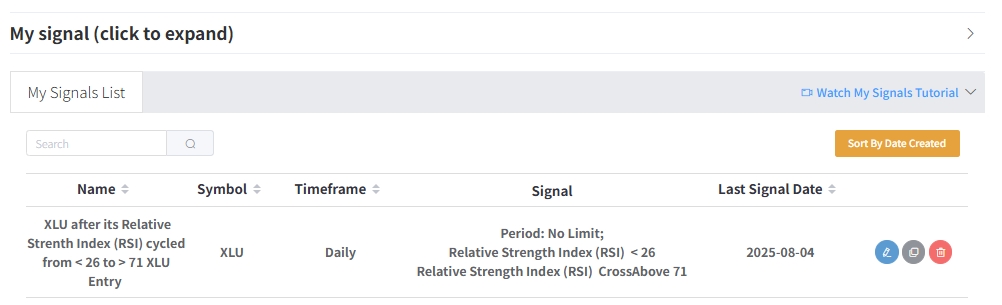
If you don't want to miss the signal's occurrence, add this signal alert to My Signals. The Backtest History interface now features a button to add entry and exit criteria to My Signal, enabling users to incorporate them into their My Signal list.
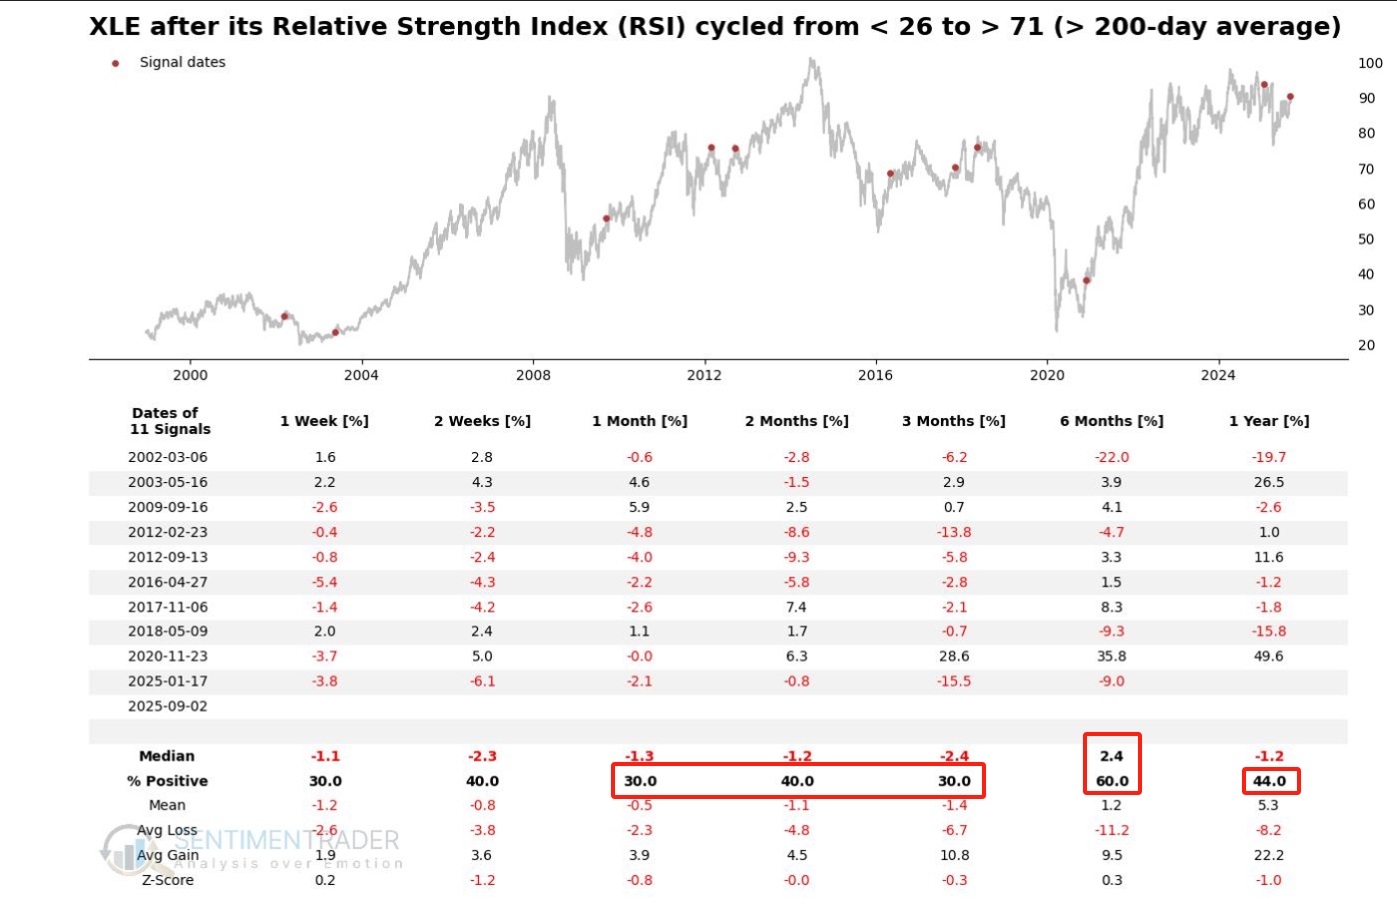
When the RSI reversal occurs with XLE above its 200-day average, a context similar to the present, the data reveals a nuanced outlook. Filtering for signals that occur only during a long-term uptrend does not appear to mitigate the short-term weakness, but it does highlight a specific period of subsequent strength.
The historical results in the one- to three-month timeframe remained challenging, with win rates holding at a low 30% and median returns staying negative. However, a significant shift occurred by the six-month mark. At that point, the win rate rose to a solid 60%, and the median return turned positive at 2.4%. Interestingly, the performance appeared to fade after that, with the win rate dropping back to 44% over the one-year timeframe. This suggests that the primary benefit of the long-term trend filter was in identifying a period of medium-term strength, rather than a sustained long-term advance. For related backtest, click here.
Other sectors
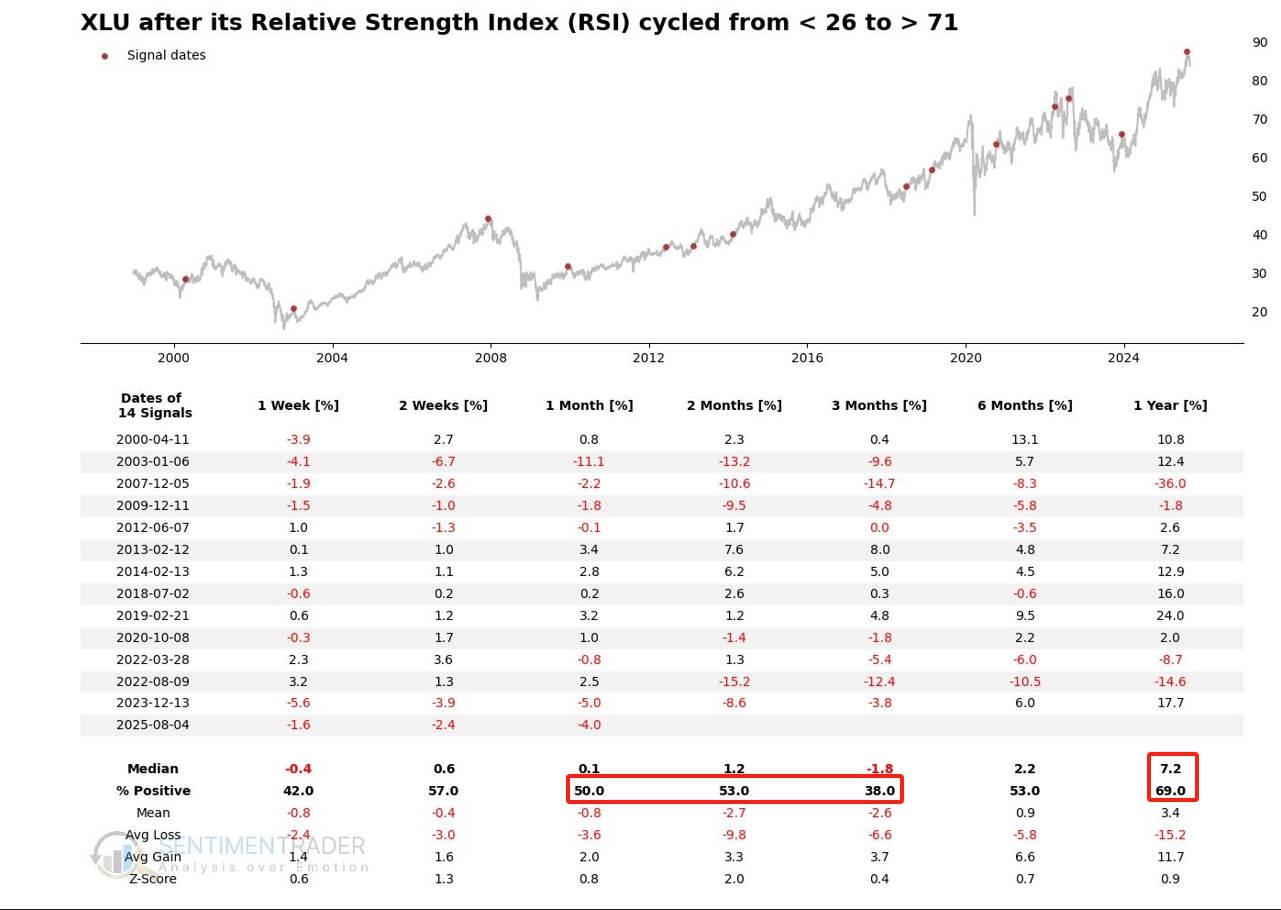
The Utilities sector ETF (XLU) also saw a similar swift RSI reversal, and an analysis of its historical precedents shows a different performance profile. The signal has heralded a choppy and inconsistent period in the short term.
Following the signal, the performance for XLU over the one- to three-month timeframe was mixed, with win rates fluctuating between 38% and 50%. However, the outlook grew progressively stronger over time. The one-year timeframe was particularly impressive, with XLU showing a positive return 69% of the time with a strong median gain of 7.2%. This suggests that for the utilities sector, this type of momentum signal has historically been a reliable indicator of long-term strength. For related backtest, click here.
What the research tells us...
A powerful price momentum signal has triggered across multiple sectors, with the Relative Strength Index cycling from a low reading to an overbought level. For the Energy Sector ETF (XLE), this signal has historically led to a challenging short-term outlook, with strength only appearing at the one-year mark. Adding a 200-day average filter offered a more nuanced picture, pointing to a pocket of strength for XLE at the six-month mark. A similar RSI reversal in the Utilities sector (XLU) showed a more robustly bullish outcome, especially over a one-year horizon. The research suggests that this momentum thrust is not a simple, universal signal; its historical implications are highly dependent on context, such as the underlying long-term trend and, most importantly, the specific sector in which it appears.