
A surprising message on the economy from our Macro Index Model

Key points:
- There seems to be a fair amount of gloom regarding the state of - and the outlook going forward for - the economy
- The Consumer Confidence Index has plunged to record lows in recent months
- However, our most venerable economic tracking model - the Macro Index Model - just hit a high not seen in the last five years
- So who will ultimately prove to be correct? The masses as they anticipate an economic slowdown? Or the cold, hard economic data itself, which is signaling growing economic strength?
- As always, time will tell - but history does offer some potential clues
Consumer gloom is rampant
The chart below shows the history of the University of Michigan Consumer Confidence index, which recently hit a new all-time low of 44.2%.
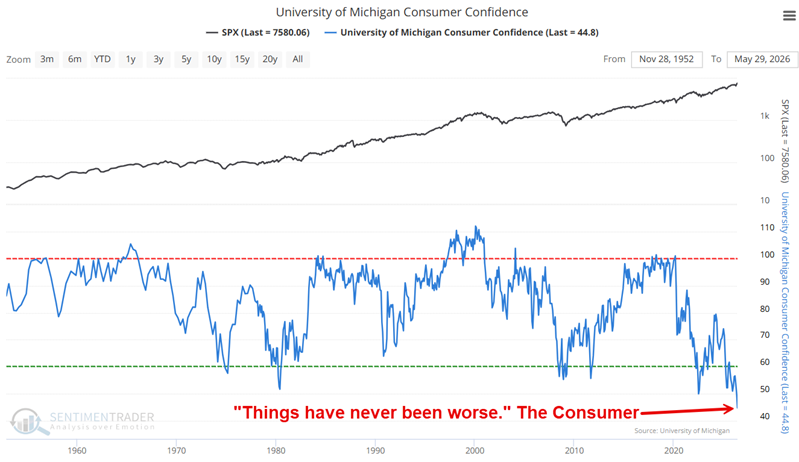
So, obviously, consumers are feeling gloomy overall about the economy. Still, it is useful to note that low readings for this index have tended to be useful contrarian signs for stocks and the economy. Will that be the case again now? It is impossible to predict for certain. But it is interesting to note that consumer sentiment has essentially fallen off a cliff while a great deal of hard economic data is finally beginning to point higher for the first time in years.
The chart below shows our Macro Index Model since 1967.
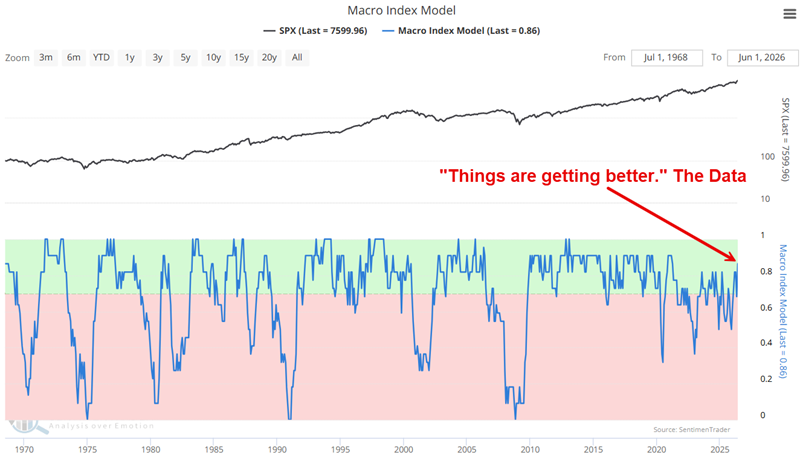
Note that the model has spent most of the last 5 years bouncing above and below the "cutoff" value of 0.70. Despite this lack of consistency in the economic indicators, a) there has not been a recession since the brief Covid-induced slowdown in 2020, and b) the stock market has mostly powered higher despite the lack of rip-roaring economic growth.
The Macro Index Model completes a "round trip"
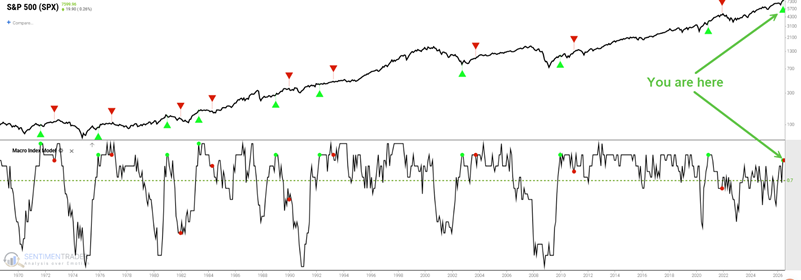
The green up arrows in the chart below highlight each time the Macro Index Model crossed above 0.85 after first dipping below 0.40. In other words, the economy dropped to an unfavorable status and then reversed higher to a period of growth. The most recent signal appears at the far right-hand side of the chart. The red arrows arbitrarily mark one year after each green up arrow.
The table below summarizes S&P 500 performance during the one-year periods highlighted in the chart above.
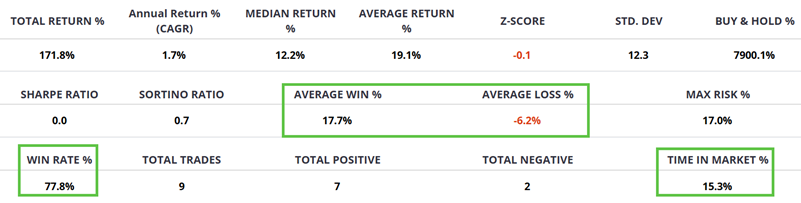
The S&P 500 results might be categorized as "good, but not necessarily great." Using an arbitrary one-year holding period, these signals were only in the market 15% of the time and enjoyed a 77.5% win rate. The average win far outpaced the average loss by a factor of 2.85-to-1 (17.7% vs. -6.2%).
To better illustrate S&P 500 performance, the chart below shows the cumulative hypothetical performance achieved by buying and holding the S&P 500 index during the one-year periods highlighted in the chart above.
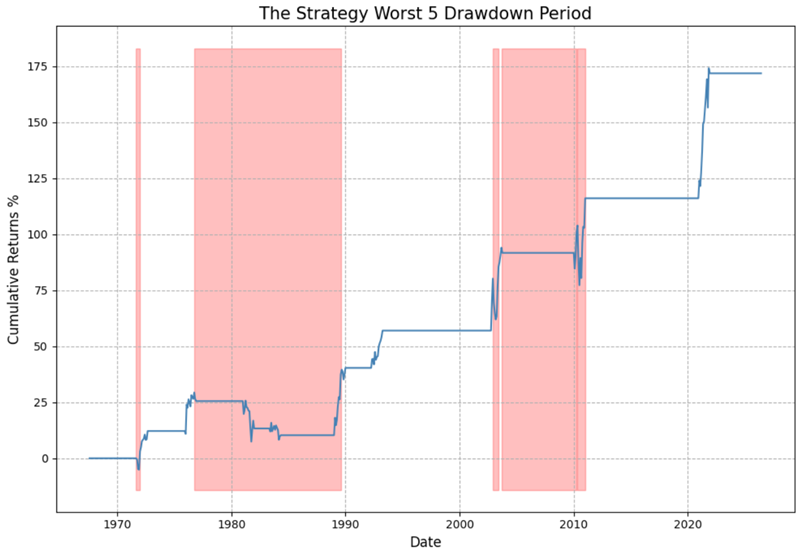
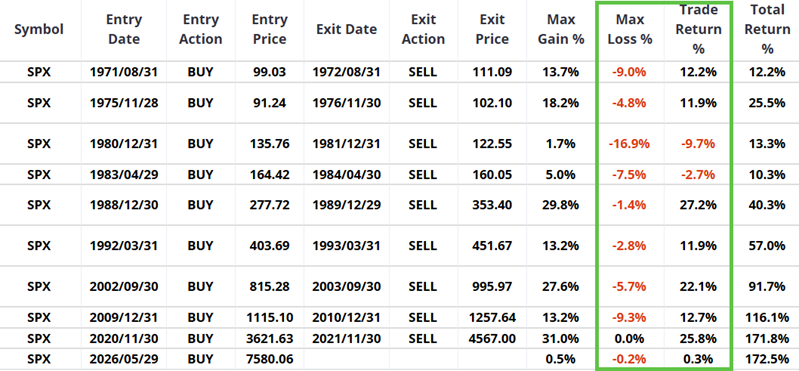
The table below puts actual numbers to the signals. One key thing to note is that all seven of the winning signals showed a double-digit 1-year gain. The two losing periods registered declines of -9.7% and -2.7%, respectively.
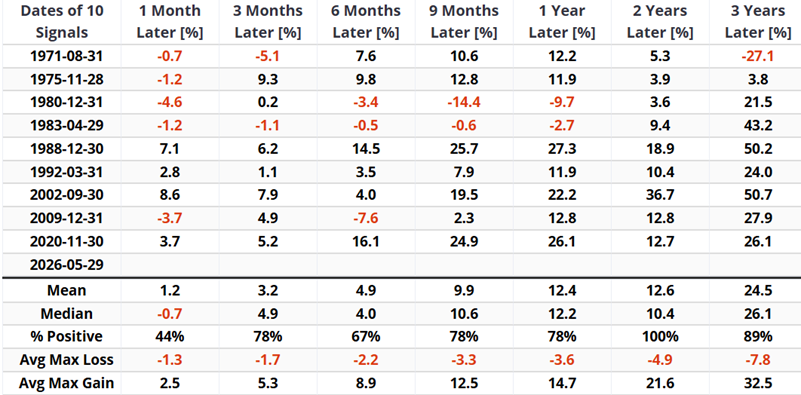
The table below shows results over a variety of time periods. Note that results typically improved over time, with a 100% win rate over two-year periods following a new signal.
Improving results by looking at sectors
Whether a trader should buy and hold the S&P 500 based solely on a Macro Index Model move from below 0.40 to above 0.85 is open for debate. However, a look at S&P 500 sector performance following the signal dates shown above reveals other possibilities.
The table below shows the performance of S&P 500 sector indices following each signal date.
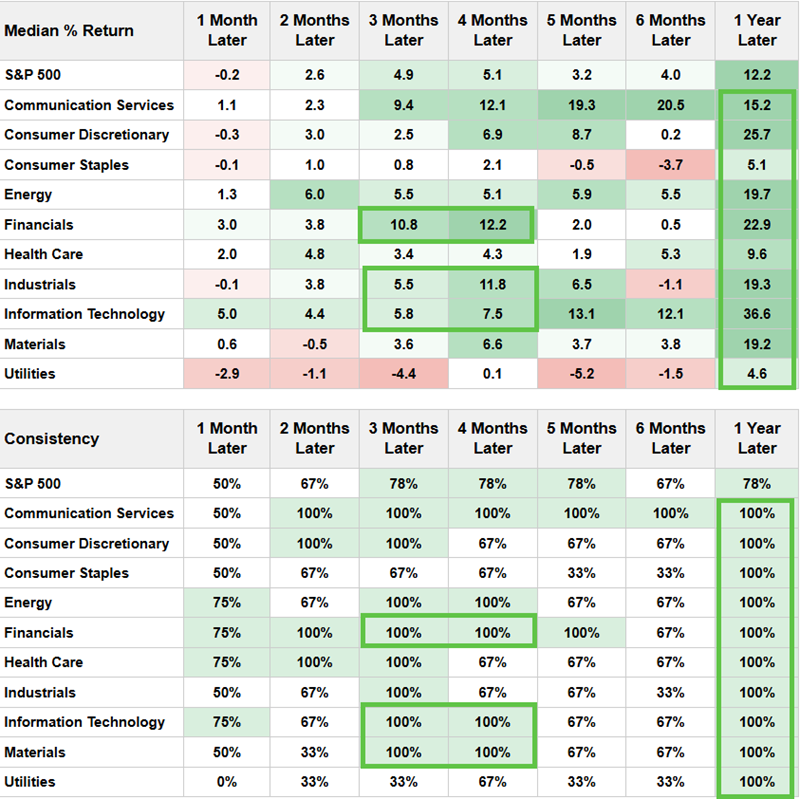
Note that a variety of sectors show 100% historical win rates for time periods of 1 to 4 months, most notably in Financials and Technology. Likewise, all sectors have to date shown a 100%-win rate for one year after a Macro Index Model <0.4 to >0.85 signal. The largest average 1-year gainers have been Technology, Financials, Energy, Industrials, and Materials.
What the research tells us…
Our Macro Index Model has finally completed a round-turn move from fairly unfavorable (i.e., below 0.40) to strongly favorable (i.e., above 0.85). History suggests this is a good thing. But first, the caveats. As always, past performance is no guarantee of future results. Every Macro Index Model move above the cutoff of 0.70 in the past five years has been followed by a fairly swift downside reversal in that index. So we'd like to see it hold in positive territory for a while to signal actual, sustainable improvement.
Likewise, just because all S&P 500 sectors have shown a gain one year after each previous signal, it does not guarantee the same between now and the end of May 2027. Nevertheless, the key point is this: Historically, when the sentiment data is overwhelmingly unfavorable (U of M Consumer Confidence) and the hard data is favorable (Macro Index Model), the odds have favored the positive outlook.