
A Surprising Clue from Financial Sector Insiders

Key points:
- Not every "squiggle" from every indicator "means something," however, sometimes useful information can be gleaned from unexpected places and in unanticipated ways
- Corporate insider buying in the financial sector is not at a significantly high level, but it picked up noticeably over the past several weeks
- Historically, this has had favorable implications for the broader stock market
An interesting anomaly in financial sector insider buying
Two things to remember: 1) Corporate insiders pay close attention to fundamentals, i.e., the anticipated changes in futures sales and earnings, and 2) They only spend their own money to buy shares of their own company when they feel quite confident about #1.
There are few more favorable signs for a given industry than a large amount of buying by executives who know it best. For example, the chart below highlights dates when our Corporate Insider Buys - XLF indicator crossed above 60 for the first time in six months. The State Street Financial Select Sector SPDR ETF (XLF) tracks the S&P 500 Financial Sector index.
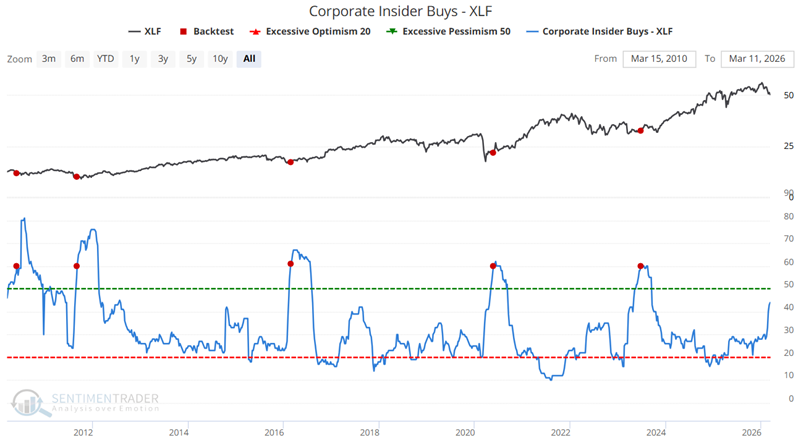
The table below summarizes results and shows the performance of ticker XLF following each signal.
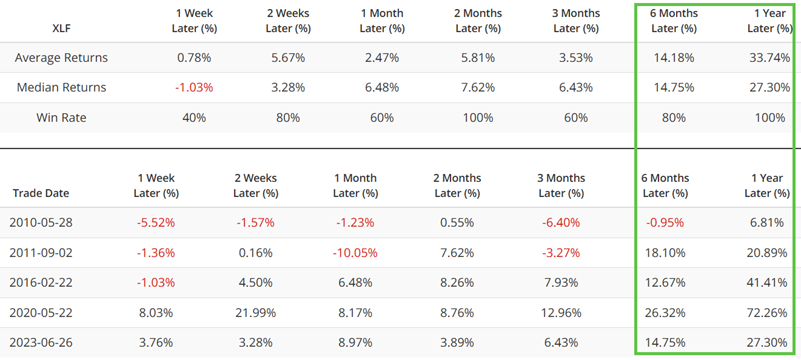
The good news is that the historical results are extremely favorable. The bad news is that the current reading for this indicator is only 51.3, and there is no guarantee that it will rise above 60 anytime soon. So, unfortunately, the signal highlighted above is not currently relevant. Still, as stated in the Key Points above, sometimes useful information can be gleaned from unexpected places and in unanticipated ways.
A 3-week surge in financial insider buying versus the S&P 500 Index
It is generally recognized that the financial sector is a key driver of the overall stock market. One thing we notice in the chart below is that, while overall buying over the past six months has not reached the "favorable" level of 60, there has been a strong surge in buying over the past three weeks.

To better visualize this, the chart below displays the 3-week change in our Corporate Insider Buys - XLF indicator. The horizontal blue line represents a 10-point change in the indicator value over 3 weeks. The most recent occurrences were on February 23rd and March 2nd.
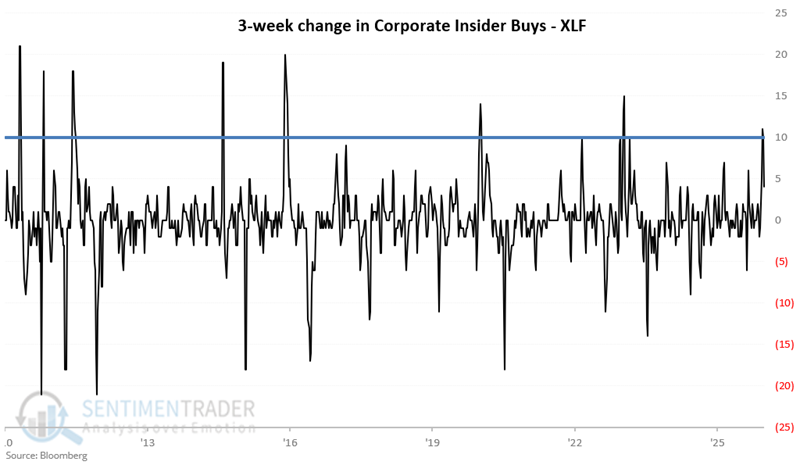
Now we will look at the performance of the S&P 500 Index following all weeks when the 3-week change in financial sector insider buying surged by +10 or more. The table below summarizes S&P 500 performance following all signals (note that overlapping signals tend to inflate z-scores).
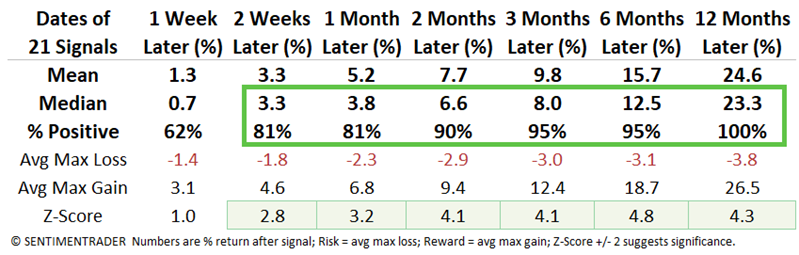
The table below displays S&P 500 performance following all "10 or above" weeks, including overlapping signals.
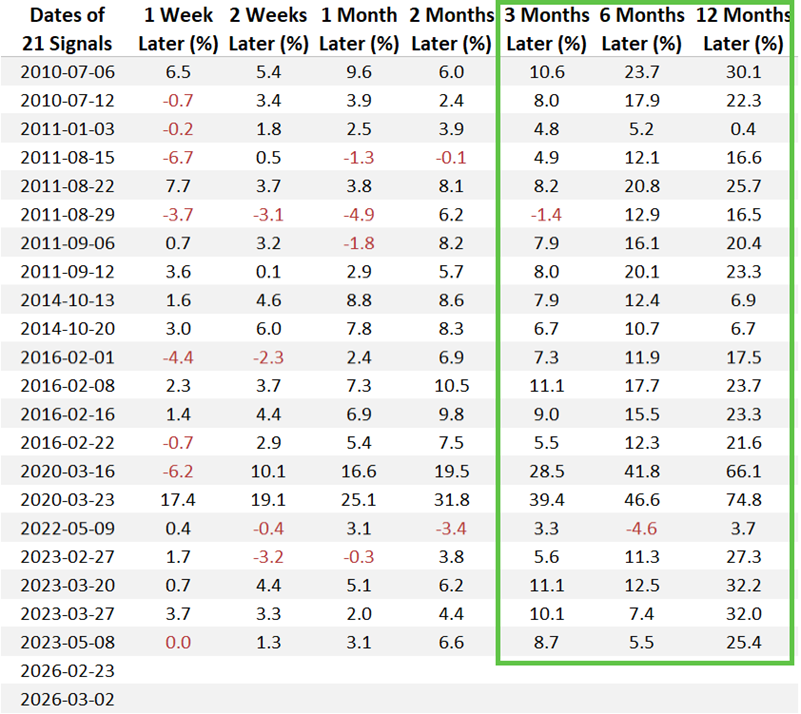
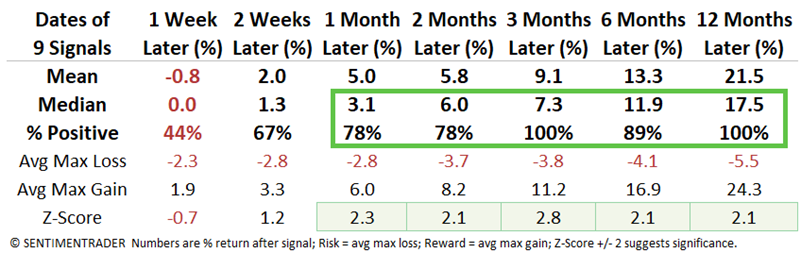
To paint a more targeted picture, let's remove overlaps and highlight only those weeks when the 3-week change in financial sector insider buying surged by 10 or more for the first time in 6 months. The table below shows S&P 500 performance following only the first 3-week change of 10 or more within any six-month period.

The table below summarizes the results for the S&P 500 Index following the dates listed in the above table.
What the research tells us…
Corporate insider activity can offer useful clues. A massive amount of buying within a given sector is almost invariably a bullish sign for that sector in the future. However, even a short-term surge in buying in a key sector can have favorable implications. So, does the recent pickup in insider buying in the financial sector guarantee a rally in the S&P 500 over the next six to twelve months? Ah, there's the rub. The realities are this: 1) No signal from any indicator is ever guaranteed to be correct the next time it flashes, and 2) the recent surge in the 3-week change in financial sector corporate insider buying does not by itself qualify as a "Buy" signal. It merely adds weight to the favorable side of the ledger for the overall stock market.