
A surge in optimism triggered a new buy signal for stocks

Key points:
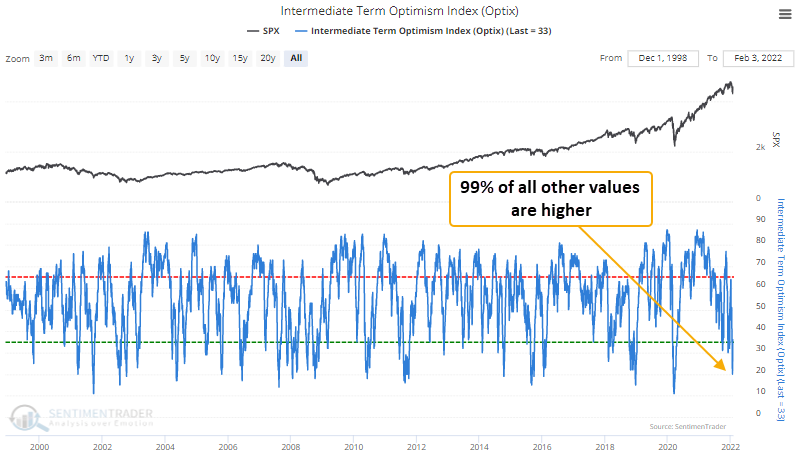
- The Intermediate-Term Optimism Index (Optix) declined to a pessimistic sentiment extreme
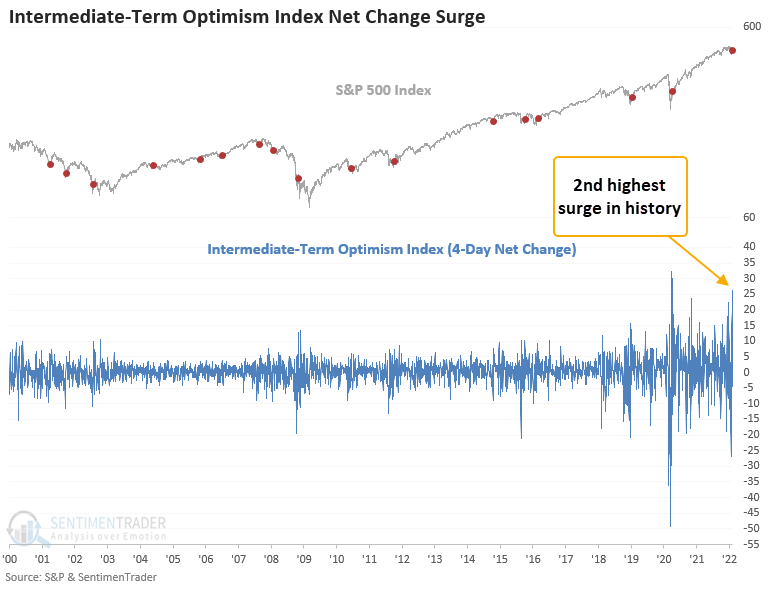
- After the extreme condition, the Optix Index net change surged to the second-highest level in history
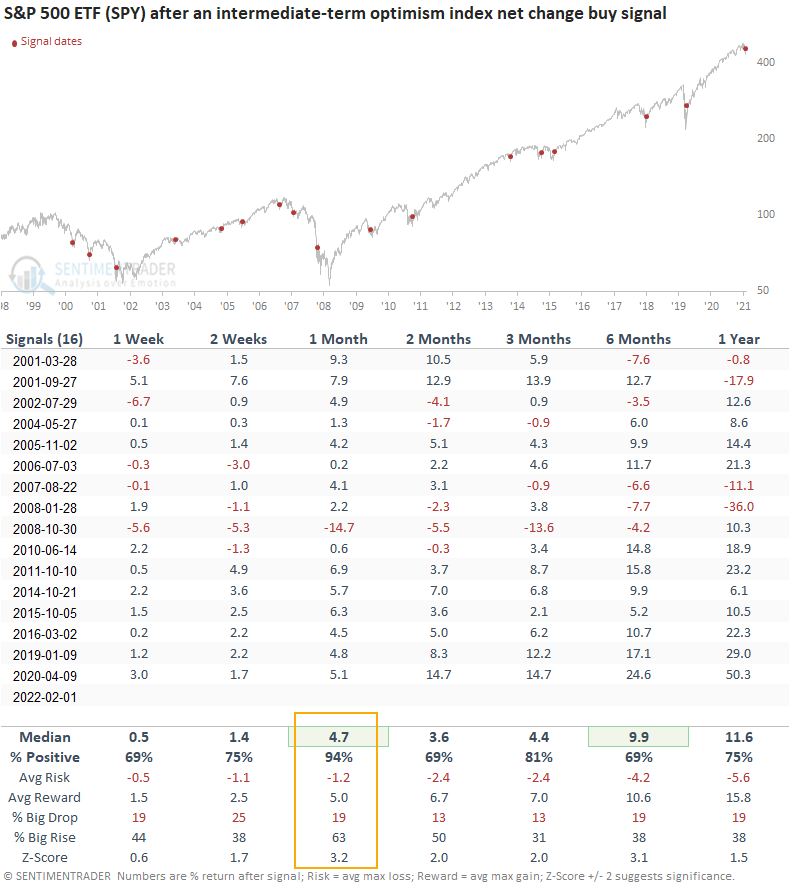
- Similar signals preceded positive returns 94% of the time 1 month later
A trading model that identifies a reversal in the Optimism index
The Intermediate-Term Optimism Index (Optix) signal identifies when the 4-day net change in the Optix Index surges by 10% or more after the index resets below a pessimistic sentiment level of 22%. Please click here to read the original concept note.
Sentiment signals work best when they reverse from an extreme condition
Similar signals have preceded gains 94% of the time
This signal triggered 16 other times over the past 21 years. After the others, S&P 500 future returns and win rates were solid across all time frames, especially the 1-month window. The two significant failures occurred during the 2007-08 bear market. I think 2004 is a compelling analog. That signal happened about a month before the Federal Reserve raised interest rates for the first time after the Dotcom bear market. The S&P 500 was consolidating, technology was underperforming, and energy was outperforming. Sound familiar.
What the research tells us...
When the Intermediate-Term Optimism Index surges from a pessimistic level, it signals that traders have become more optimistic about the future direction of stocks. Using the Optix index to measure that change in sentiment, similar setups to what we're seeing now have preceded rising stock prices, especially in the 1-month window.