
A surge in consumer confidence versus stock market sectors

Key Points
- The University of Michigan Consumer Confidence index moved sharply higher in the latest monthly survey
- Historically, sector performance has been relatively strong following such action - particularly in the last 20 years
- Consumer Discretionary, Financials, and Telecommunications have tended to be top performers
University of Michigan Consumer Confidence
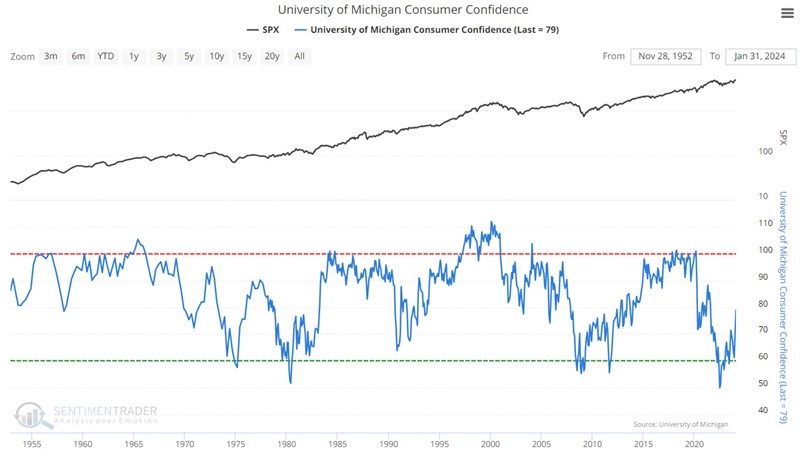
The chart below displays the history of The Thomson/Reuters University of Michigan Consumer Sentiment Index (heretofore referred to as University of Michigan Consumer Confidence, or UMCC for short). In the latest monthly survey, the Index surged from 69.7 to 79.
The University of Michigan Consumer Sentiment Index is a consumer confidence index published monthly by the University of Michigan.
The Index is normalized to have a value of 100 in December 1964.
The consumer confidence measures were devised in the late 1940s by George Katona at the University of Michigan. They have now developed into an ongoing, nationally representative survey based on telephonic household interviews. The Index of Consumer Sentiment (ICS) is created from these interviews.
It gives a very accurate indication of the future course of the national economy. The Index of Consumer Expectations (a sub-index of ICS) is included in the Leading Indicator Composite Index published by the U.S. Department of Commerce, Bureau of Economic Analysis.
The Index was created and still is published with the following objectives:-
- Assessment of consumer attitudes on business climate, personal finance, and spending
- To create the capability for understanding and forecasting changes in the national economy
- Directly incorporate empirical measures of consumer expectations into models of behavior
- To forecast the economic expectations and the future spending behavior of the consumer
- To judge the level of optimism/pessimism in the consumer's mind
The Index of Consumer Expectations focuses on three broad areas:-
- How consumers view prospects for their own financial situation
- How they view prospects for the general economy over the near term
- Their view of prospects for the economy over the long term
The survey polls approximately 300 consumers for a preliminary figure and 500 for a final figure.
Like most other sentiment surveys, this is a coincident indicator. When times are good, consumers are happy; when times are bad, they are less optimistic. The keys to watch for as investors are when divergences occur between sentiment and the stock market, and, more significantly, times of extreme confidence or pessimism.
At the extremes, the survey is a decent contrary indicator. When the survey recorded readings over 100, it coincided with times of economic expansion and good stock market performance. Generally, stocks underperform after such occurrences.
When the survey recorded readings under 70, it coincided with challenging market conditions. However, when consumers recognize and extrapolate it, we're usually nearing the trough, and the stock market tends to bottom not long after.
The survey crosses above 75
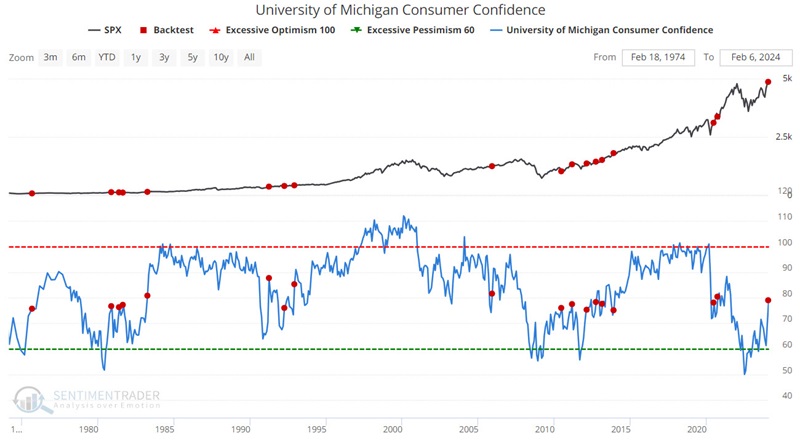
The chart below highlights each time the UMCC crossed above 75 versus the S&P 500 Index.
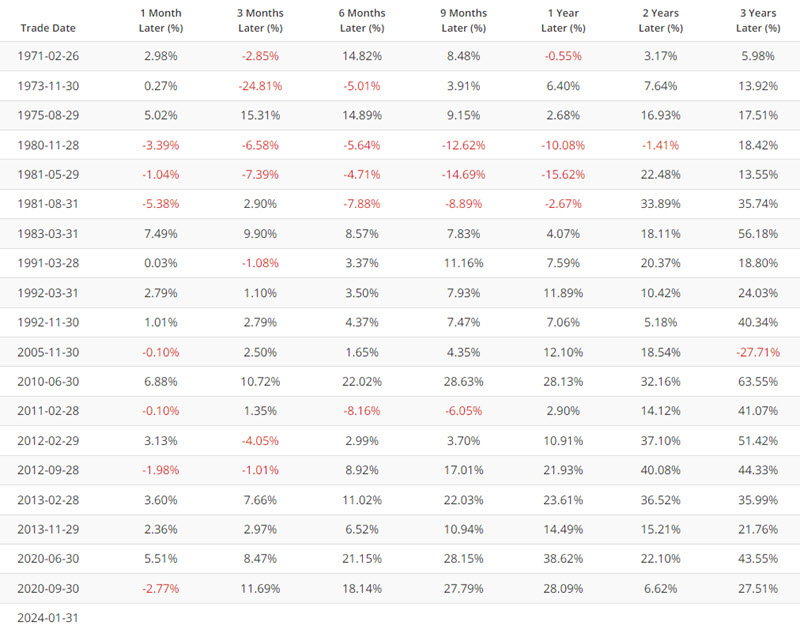
The table below displays signal-by-signal results for the S&P 500 following each cross above 75.
The table below summarizes the S&P 500 index performance following these readings.
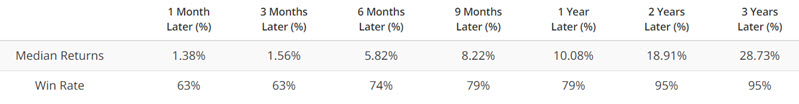
These results are something of a mixed bag. The Win Rates for six months to 3 years are higher than the average of all months (for 2 and 3 years out, the Win Rate is 95%, versus an average two and 3-year Win Rate of 85%). This suggests a higher-than-average probability of higher stock prices in the years ahead. However, for nine months to 3 years, the Median Return is actually lower than the overall average of all months.
So, should we write off the recent surge in UMCC as not meaningful? Not necessarily.
In the test above we considered all crosses above 75 including overlaps (notably in 1981, 1992, 2012, 2013 and 2020). In the test below, we only consider the first UMCC cross above 75 within the last 12 months.
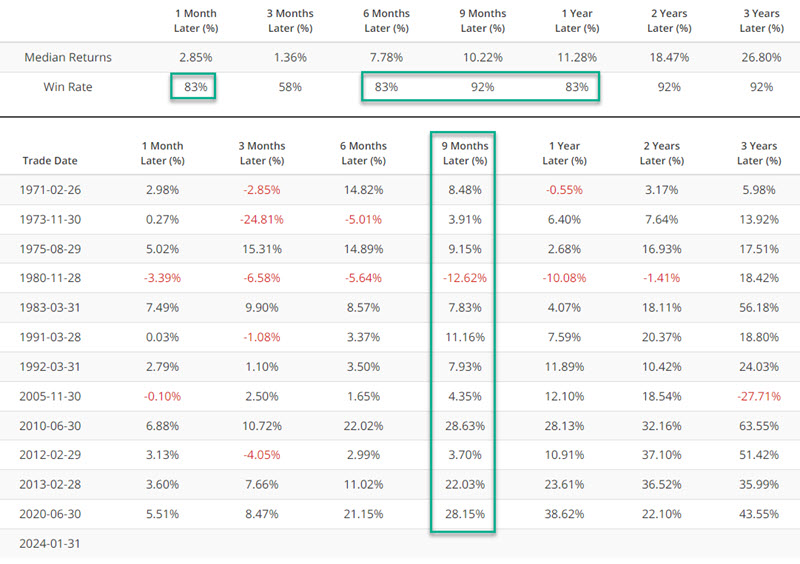
Note that Median Returns and Win Rates improved for 1-month, 6-month, 9-month and 1-Year periods. The 9-month period enjoyed a 92% Win Rate and a Median Return of +10.22%. Not spectacular, but solid.
Turning our attention to sectors
Next, let's focus on the 11 major S&P 500 sectors. For this test, we will use index data from 1970 into 2005 (highlighted in yellow, except as noted below). From there, we will use data for the SPDR ETFs that track each major sector index (highlighted in green).
NOTES: For the Telecommunications sector, index data is used until 2018, when ticker XLC started trading. Also, for the sake of continuity, for the real estate sector we use the ticker IYR, which tracks the Dow Jones US Real Estate Index but started trading in 2000. Ticker XLRE is an ETF that tracks the actual S&P 500 Real Estate Sector and should probably be used going forward.
The table below displays the 12-month return for each sector following each UMCC cross above 75. Because we are testing effect on performance and not using this as a buy/sell trading model, this test goes back to including any and all signals, including overlaps.
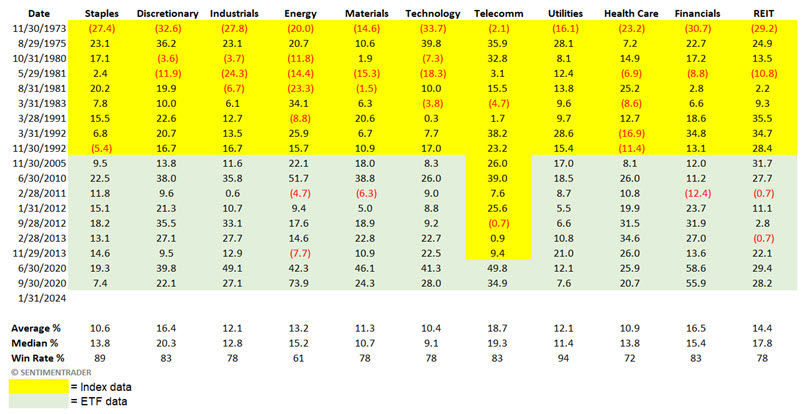
A close perusal of the table above reveals mixed overall results in the 1970s into the 1990s - although Utilities had only one negative one-year return following UMCC signals, and Consumer Staples and Telecom only two.
A close look at the bottom half of the above table shows many significant winners from 2005 to the present.
Better performance in the last 20 years
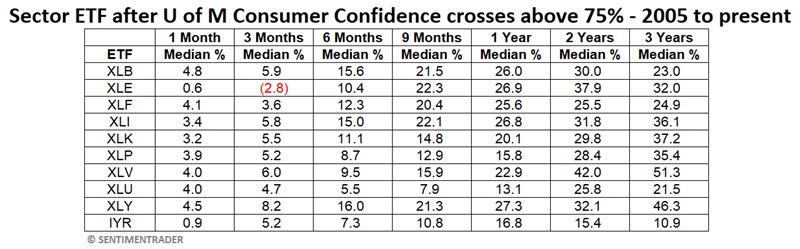
Looking at ETF performance since most S&P 500 sector ETFs started trading, we see some impressive results. The table below summarizes the median returns for each sector fund since 2005. Seven of the 11 sectors have shown a median 1-year gain excess of +20%.
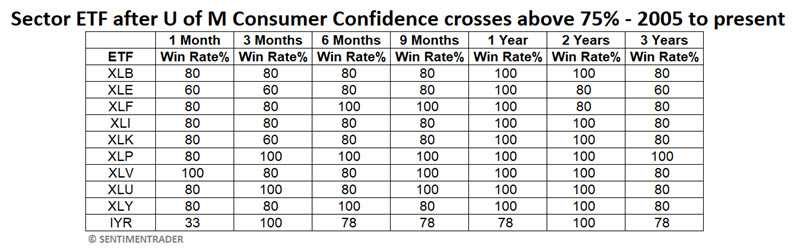
To drive this point home, the table below displays Win Rates for each sector across various holding periods. Real estate was the only sector that did not show a 100% 1-year Win Rate.
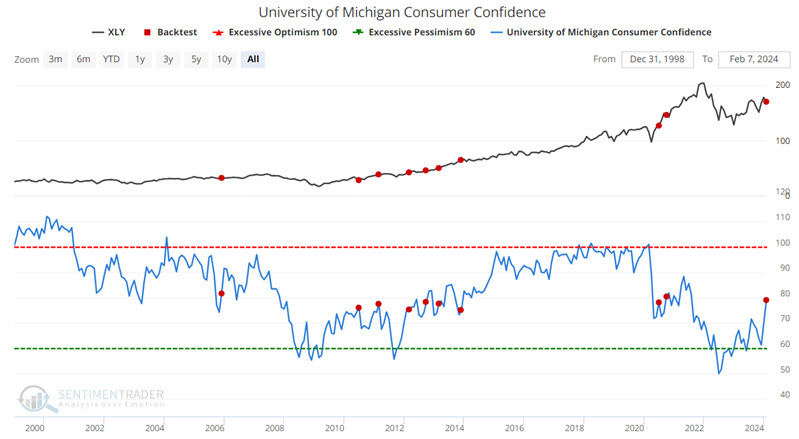
One ETF performing well following crossed above 75 by the UMCC is ticker XLY, representing the consumer discretionary sector. It should not be inferred that XLY will necessarily outperform other sectors in the year ahead, but we highlight its performance below for illustrative purposes.
The chart below highlights all instances dates when the UMCC crossed above 75 versus ticker XLY.
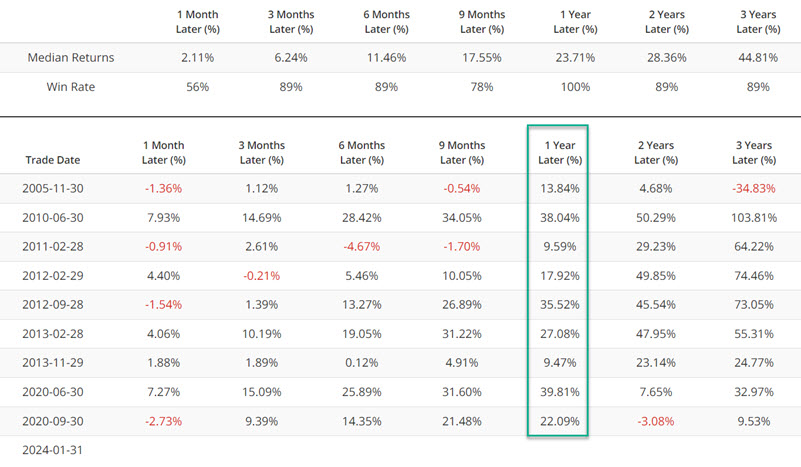
The table below summarizes XLY performance following signals since 2005
What the research tells us…
So, does the latest move in the UMCC mean that investors should load up on stocks in anticipation of a continued surge in the year ahead? Not necessarily. The recent surge in the UMCC is best thought of as "weight of the evidence" and not as a standalone trading model that generates automatic buy and/or sell signals. From the 1970s to 1990s, overall sector performance was very mixed (Consumer Staples, Telecomm, and Utilities were strong performers, following UMCC signals, Energy, Industrials, and Health Care, not so much). In the past 20 years, overall sector performance following UMCC surges above 75 has been terrific. Of course, the S&P 500 Index is up almost 300% during this time, so strong sector performance should be no surprise. For now, the latest signal from the University of Michigan Consumer Confidence Index serves as a tailwind for stocks and as added weight to the favorable side of the bullish/bearish ledger.