Products
SentimenTrader Trading Tools
‍
Backtest Engine
My Trading Toolkit
Correlation Analysis
Seasonality
Indicators & Data API
‍
Proprietary Indicators & Charts
Market Data API
Strategies & Scanner
‍
50+ Trading Strategies
Smart Stock Scanner
Research Reports
‍
Research Solutions
Reports Library
Free Resources
Simple Backtest Calculator
Simple Seasonality Calculator
The Kelly Criterion Calculator
Sentiment Geo Map
Public Research Reports
Pricing
Company
About
In the News
Testimonials
Client Success Stories
Contact
Log inLoginSign up
< BACK TO ALL REPORTS

A surge in 4-week lows for the Nikkei 225

Dean Christians
2021-04-22
Let's review forward returns for the Nikkei 225 when new lows surge by 73% or more.

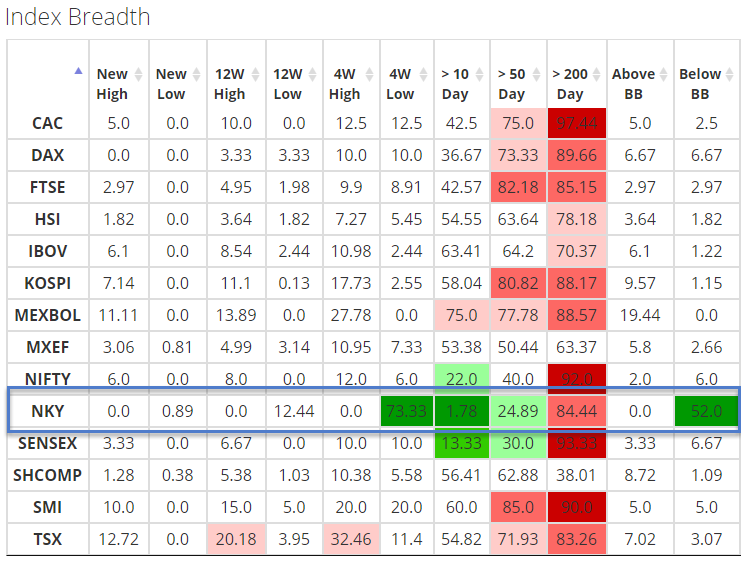
The market breadth table on the SentimenTrader website is an excellent place to review and compare breadth measures for domestic and global indexes.

As I scanned the global index table last night, I noticed several of the short-term Nikkei 225 breadth measures had deteriorated by a material amount of late. One of the measures, the percentage of Nikkei 225 members registering a 4-week low, surged above 73% on 4/21/21. The weak breadth conditions for the Nikkei 225 stand out like a sore thumb as internal participation measures on a domestic and global basis have been strong since the pandemic low.

Let's review forward returns for the Nikkei 225 when new lows surge by 73% or more.

Global Index Breadth

You can find the table under the Spotlight on Breadth page on the site.

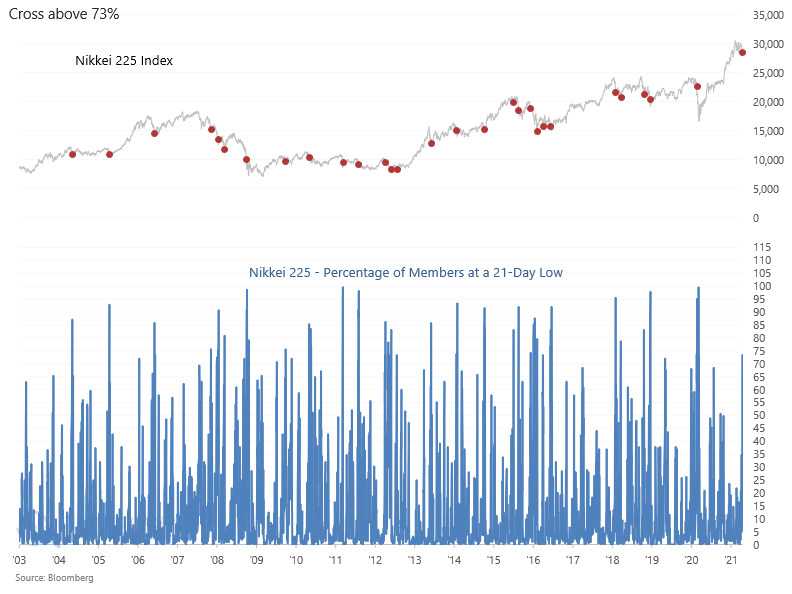
Historical New Low Chart

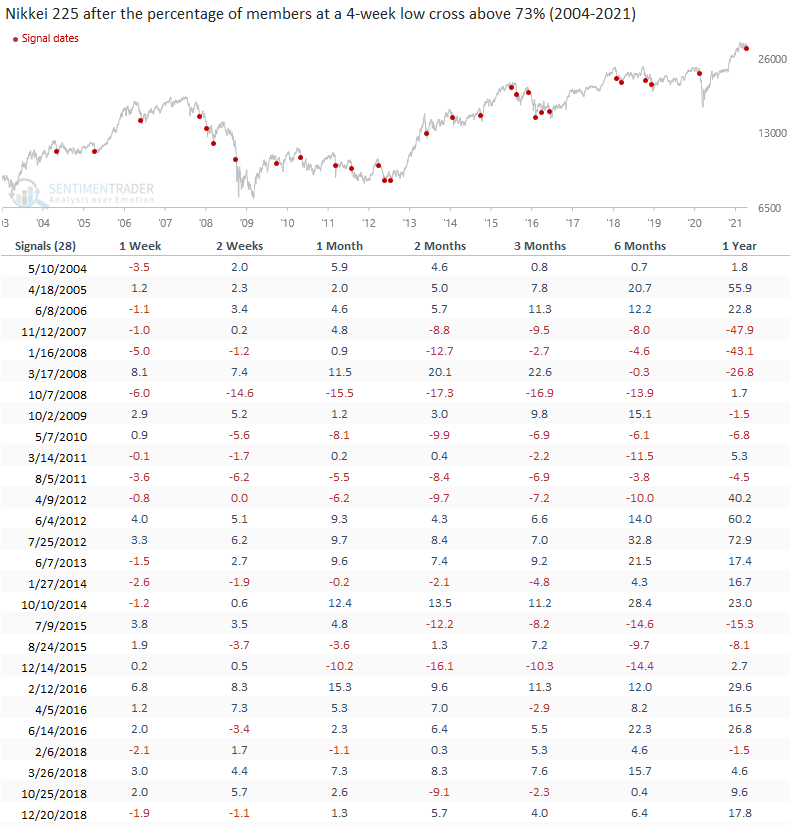
The following chart contains all 28 instances when the percentage of 4-week lows crossed above 73%. I used a 21-day holding period to screen out repeat signals. If you would like to run this study using the back-test engine, please click here. 

Signal Performance

The 1-month timeframe provides a slight edge, but it's not something that gets me excited about jumping in and playing a mean reversion oversold signal. 

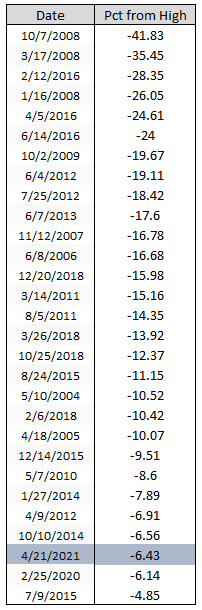
As I studied the data, I noticed that the surge in new lows occurred reasonably close to the most recent high. If I sort the instances based on the distance from the high, one can see that the current signal occurred with the index down 6.43%. 

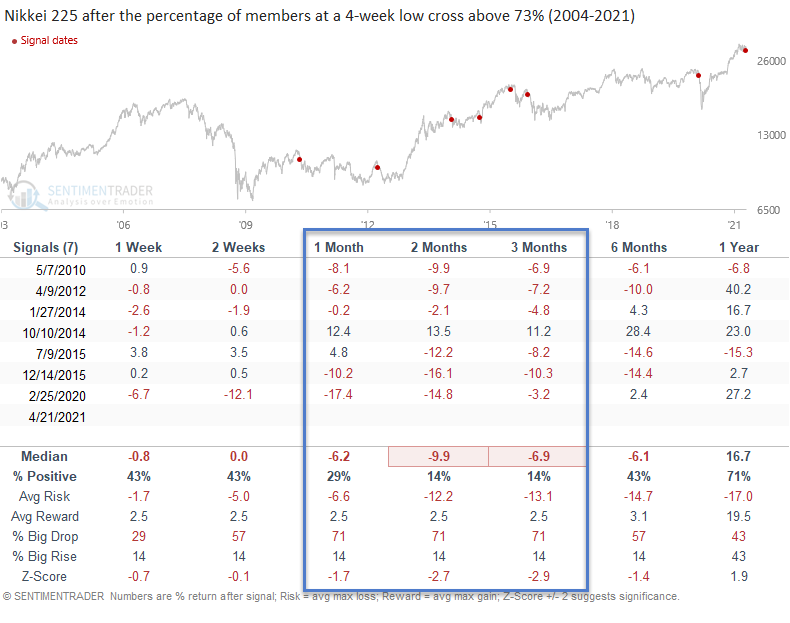
Let's see what happens with signal performance when I isolate the instances within 10% of the high.

Percentage Distance from High

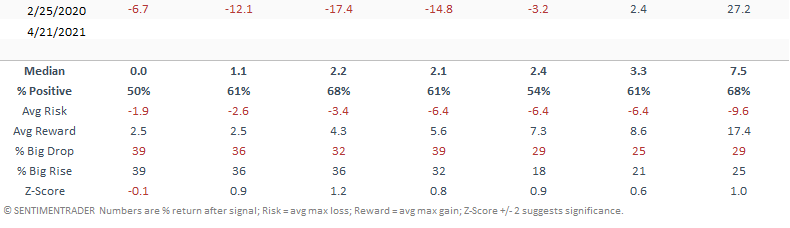
Signal Performance for Instances within 10% of 252-Day High

While the sample size is smaller, we see a drastically different story regarding forward returns with several notable z-scores in the 1-3 month timeframe. I would consider the short-term breadth weakness as a momentum sell signal and avoid any mean reversion long trades until momentum flips the other way.


Sorry, you don't have access to this report

Upgrade your subscription plan to get access
Go to Dasboard
PRODUCTS
SentimenTrader
Trading Tools
Indicators & Data API
‍
Strategies & Scanner
‍
Research Reports
FREE
RESOUrCES
Simple Backtest
Calculator
Simple Seasonality
Calculator
The Kelly Criterion
Calculator
Sentiment Geo Map
‍
Public Research Reports
‍
Pricing
Bundle pricing
‍
Announcements
‍
FAQ
COMPANY
‍
About
‍
In the News
‍
Testimonials
‍
Client Success Stories
CONTACT
‍
General Inquiries
‍
Media Inquiries
‍
Financial Professionals Inquiries
‍
© 2025 Sundial Capital Research Inc. All rights reserved.
Setsail Marketing
TermsPrivacyAffiliate Program
Risk Disclosure: Futures and forex trading contains substantial risk and is not for every investor. An investor could potentially lose all or more than the initial investment. Risk capital is money that can be lost without jeopardizing ones’ financial security or life style. Only risk capital should be used for trading and only those with sufficient risk capital should consider trading. Past performance is not necessarily indicative of future results.

Hypothetical Performance Disclosure: Hypothetical performance results have many inherent limitations, some of which are described below. No representation is being made that any account will or is likely to achieve profits or losses similar to those shown; in fact, there are frequently sharp differences between hypothetical performance results and the actual results subsequently achieved by any particular trading program. One of the limitations of hypothetical performance results is that they are generally prepared with the benefit of hindsight. In addition, hypothetical trading does not involve financial risk, and no hypothetical trading record can completely account for the impact of financial risk of actual trading. for example, the ability to withstand losses or to adhere to a particular trading program in spite of trading losses are material points which can also adversely affect actual trading results. There are numerous other factors related to the markets in general or to the implementation of any specific trading program which cannot be fully accounted for in the preparation of hypothetical performance results and all which can adversely affect trading results.

Testimonial Disclosure: Testimonials appearing on this website may not be representative of other clients or customers and is not a guarantee of future performance or success.