
A substantial surge in 4-week highs for the KOSPI

Key points:
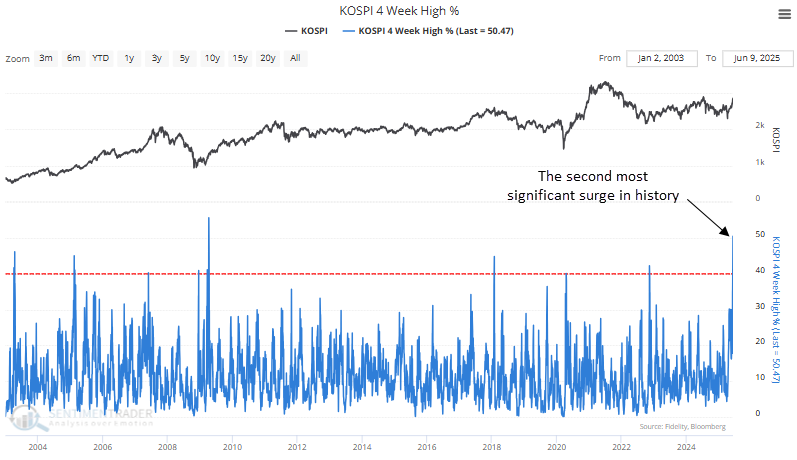
- The percentage of KOSPI stocks reaching a 4-week high surged above 50%
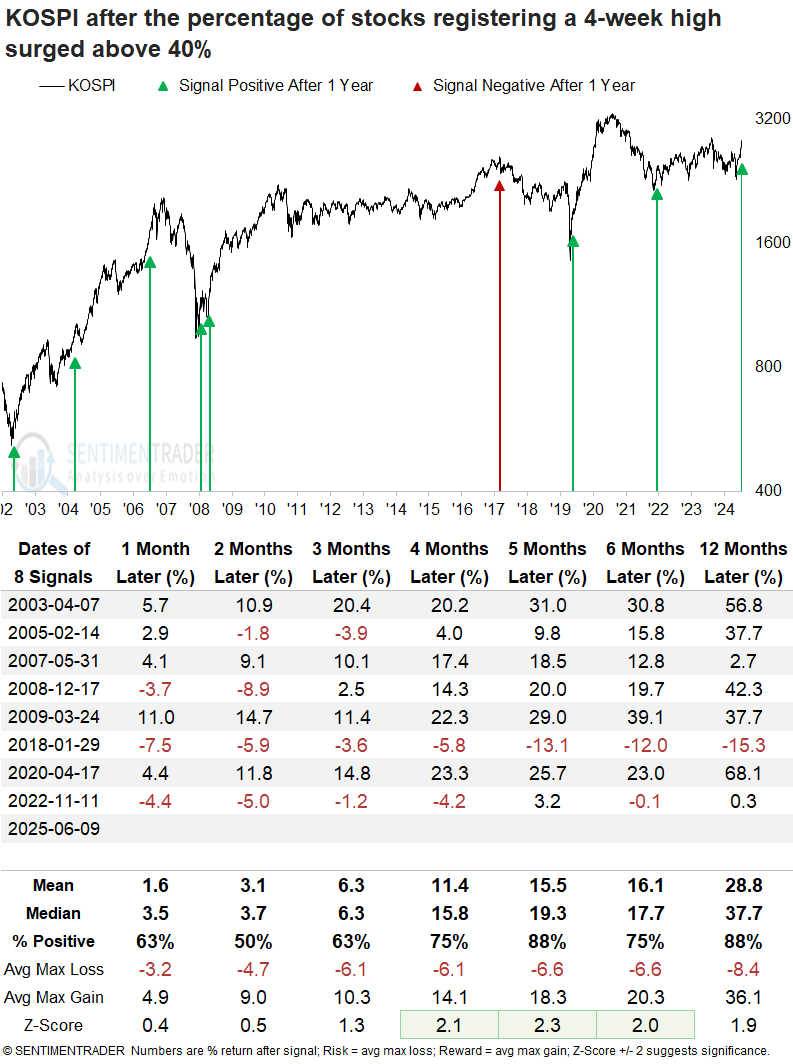
- Similar expansions in 4-week highs saw the KOSPI rise in all but one case over the subsequent year
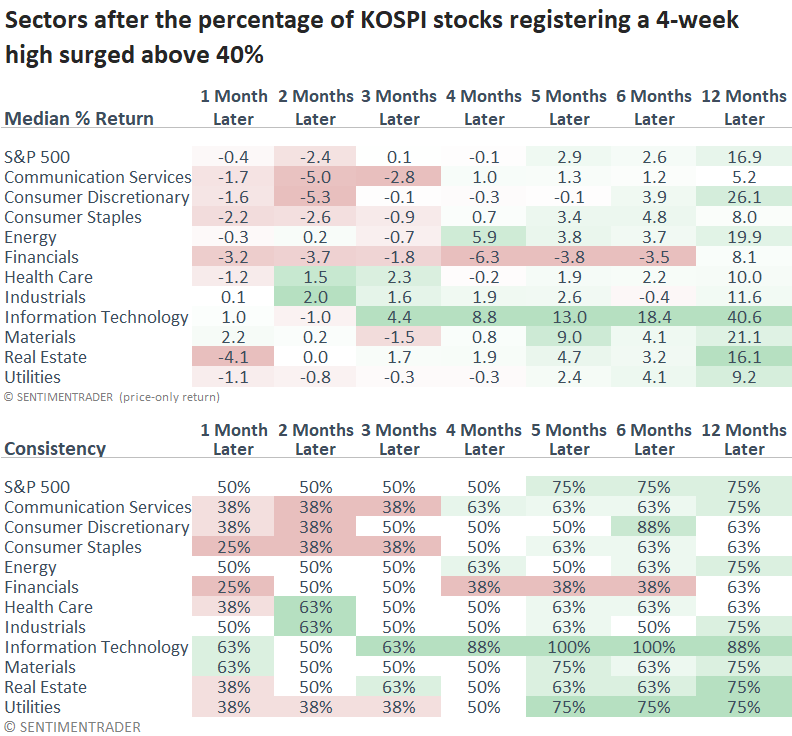
- U.S technology and semiconductor groups performed exceptionally well after these signals
Does a massive surge in new highs for KOSPI stocks imply good things for the technology sector?
The percentage of KOSPI stocks hitting a 4-week high surged to the second-highest level on record, surpassed only by the peak seen in April 2009 when stocks were emerging from the Global Financial Crisis.
Why does a surge in new highs for an index based in South Korea matter?
Because the KOSPI features leading multinational giants such as Samsung Electronics, SK Hynix, LG Electronics, and Samsung SDI, companies that dominate the semiconductor, consumer electronics, display, and battery sectors, all of which are essential components of the global technology supply chain.
Similar breadth thrusts preceded positive returns
Although the sample size is limited, whenever the proportion of KOSPI stocks reaching a 4-week high increased above 40%, the benchmark Korean index displayed solid returns and consistency from four to twelve months later, with several of those horizons displaying significance.
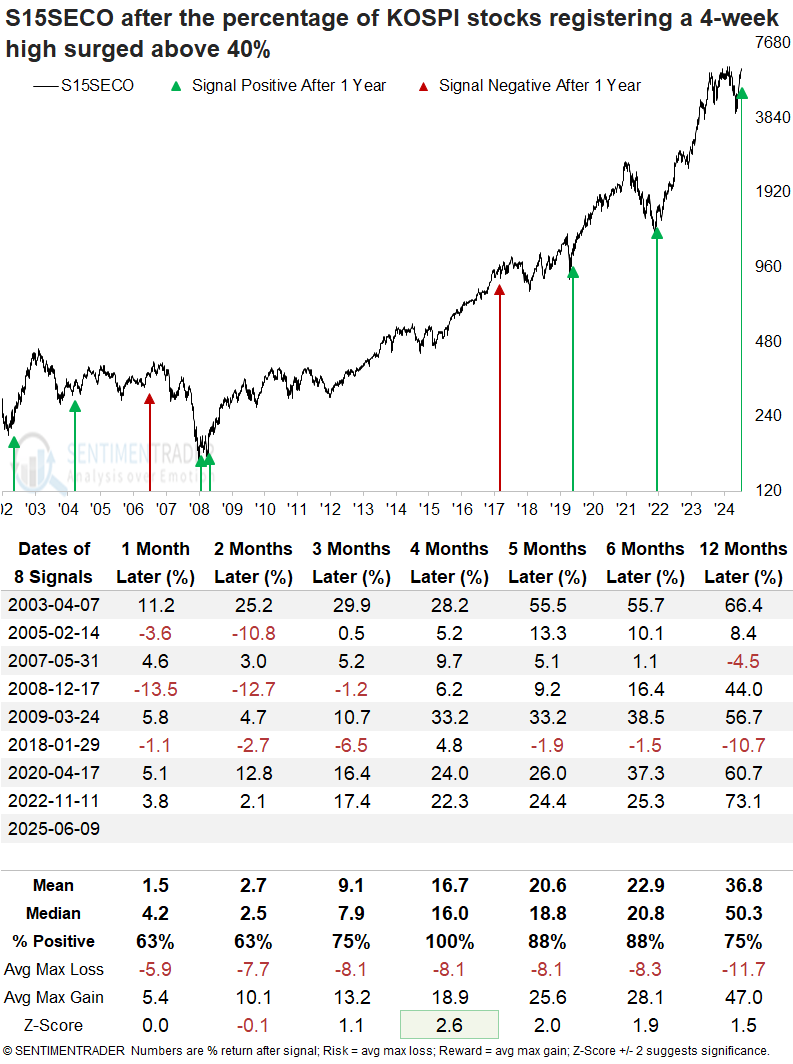
Let's see if the surge in new highs points to a rally in the S&P 1500 Semiconductor group. i.e., if the rising tide is indeed lifting all boats.
The broad U.S. semiconductor index delivered strong and consistent returns over the following year, recording gains at the four-month mark in every instance.
The S&P 500 Technology sector demonstrated outstanding returns and consistency, outperforming the S&P 500 across all evaluated time horizons.
Trend scores suggest a favorable backdrop
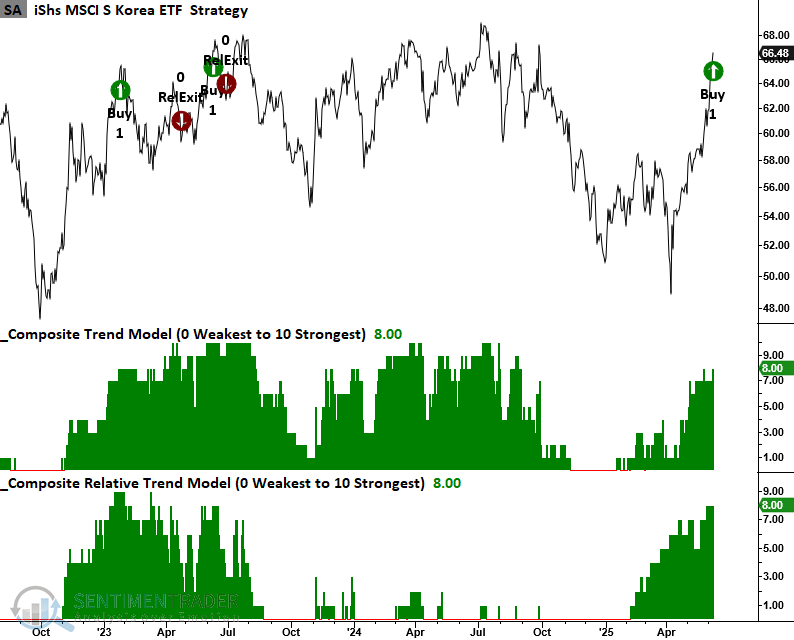
The South Korean ETF universe is relatively small, with the iShares MSCI South Korea ETF (EWY) leading in assets and liquidity. However, investors should note that EWY is heavily concentrated, with Samsung Electronics and SK Hynix accounting for 31% of its market capitalization.
On Monday, EWY triggered a trend score buy signal when it recorded a 42-day absolute and relative high as both the trend and relative trend indicators maintained a score of eight or higher.
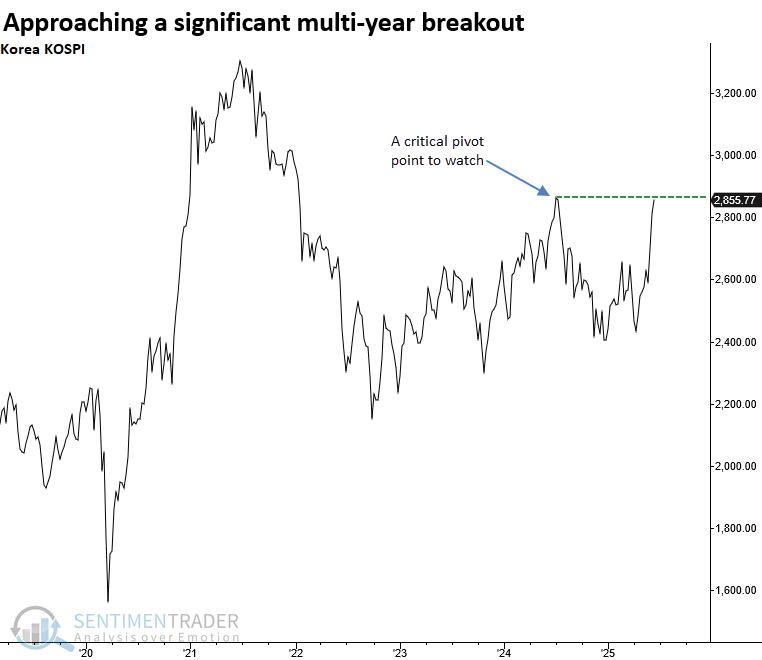
The KOSPI appears to be on the cusp of a multi-year breakout, with prices approaching long-term resistance. A sustained move above this key level would confirm a significant technical breakout, potentially unlocking considerable upside as investor confidence builds and capital flows return.
What the research tells us...
The number of stocks in the KOSPI hitting 4-week highs surged to the second-highest level in history, a rare breadth thrust that historically precedes strong and sustained gains. In previous instances of similar magnitude, the KOSPI and U.S. technology stocks consistently posted positive returns over the following year, underscoring the significance of this signal. As South Korea plays a critical role in the global supply chain for semiconductors and electronics, this surge could reflect a broader global uptick in technology demand, particularly driven by advancements in artificial intelligence. Adding fuel to the rally, the Bank of Korea has been cutting interest rates, providing additional support for equities and reinforcing the case for a sustained move higher.