
A strategic approach to September

Key points:
- September has been the undisputed worst month of the year for stocks
- In practice, results can vary widely from year to year
- A simple intramonth pattern may help investors improve long-term results
September has been the worst month for stocks by far
For reasons no one can fully explain, the stock market has historically performed well in some months and much more poorly in others.
For testing purposes, we broke the 105 years from 1920 through 2024 into two periods: the first 52 years, which run from 1920 through 1972, and the final 53 years, which run from 1972 through 2024. Using monthly price action for the S&P 500 from 1920 through 2024, the table below displays the cumulative gain or loss for each month of the year for these two periods and the whole 105-year history.
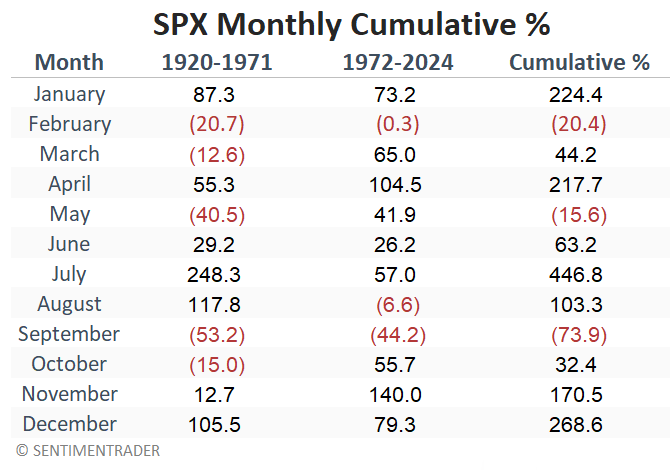
February and September are the only months that show a negative return over both periods. But more importantly, September is by far the worst performer over both test periods.
A closer look at September returns
So is the stock market doomed to suffer in the month ahead solely because the calendar reads September? Not necessarily.
Below, we see the cumulative performance of $1 invested in the S&P 500 only during September every year since 1920. While the overall results are dismal, the S&P 500 showed a gain in plenty of years.
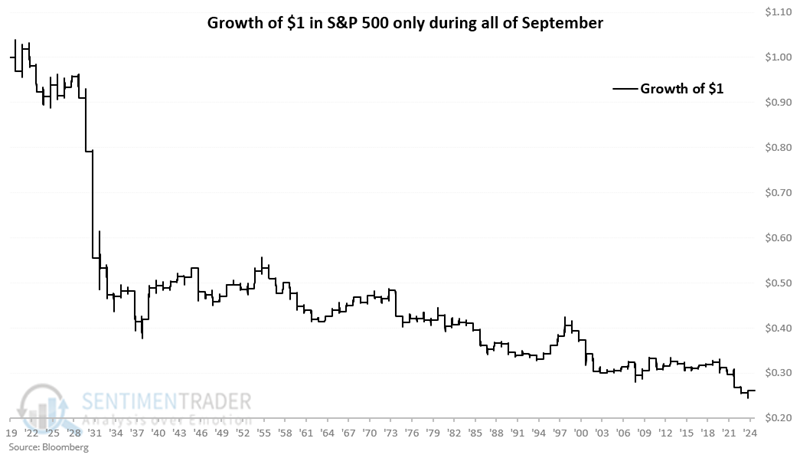
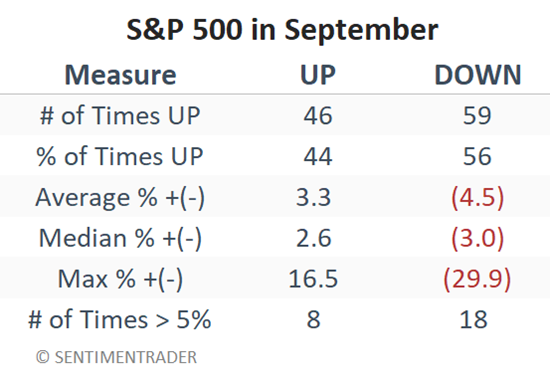
In all, September has shown a gain 44% of the time. Its average return during down years was more negative than its average return during up years, and it showed a greater tendency to see a large loss than a large gain.
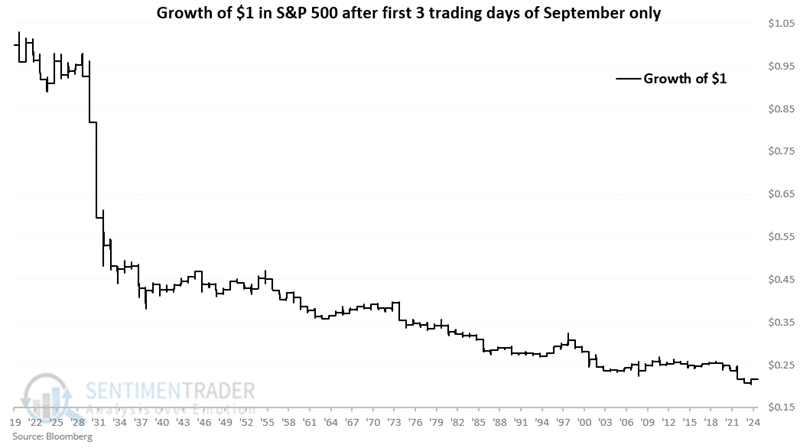
Zooming in on a September quirk
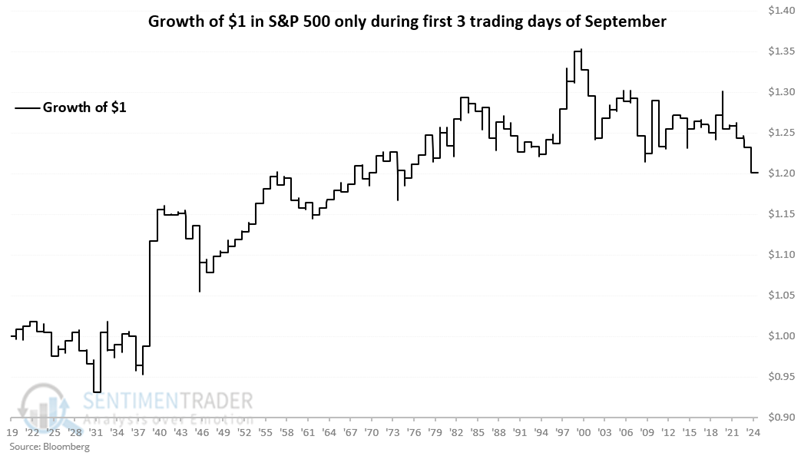
The stock market tends to show strength around holidays, and September's first three trading days invariably occur directly before or after Labor Day.
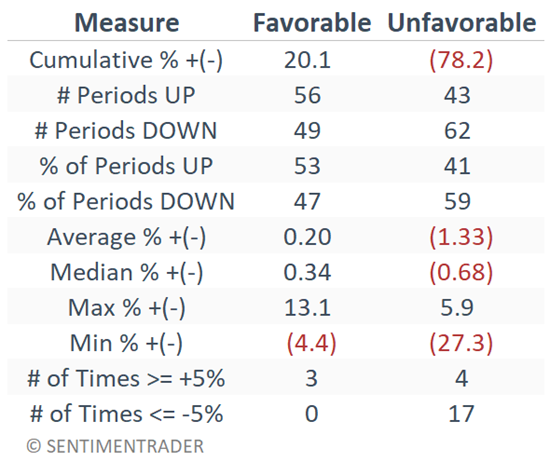
Below, we break down September's performance by the first three trading days of the month compared to all other trading days. Over the last 105 years, the S&P 500 has registered a modest 20% cumulative gain during the first three trading days of September and an abysmal 78% cumulative loss during all other trading days through the end of the month.
The table below compares S&P 500 performance during these two intramonth periods ("Favorable" meaning the first three trading days, and "Unfavorable" meaning the rest of the month). The key things to note are the 59% loss rate after the first three trading days, and 17 declines of 5% or more versus only four gains of 5% or more after the first three trading days.
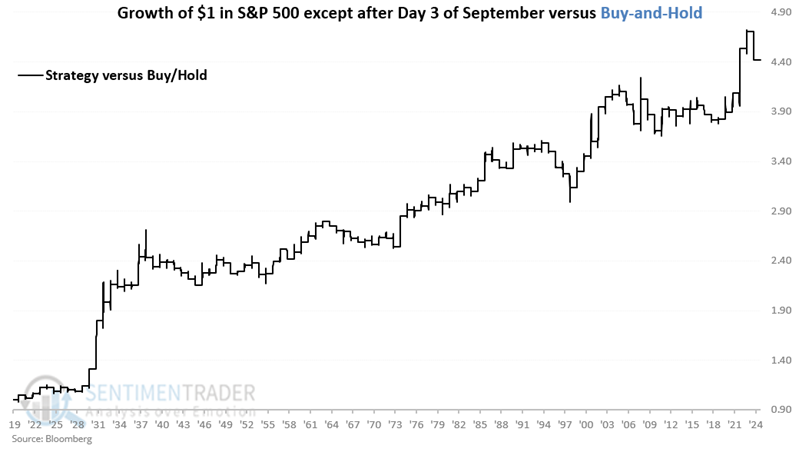
Introducing the September Strategy
The September Strategy exits stocks at the close on the third trading day of September each year and re-invests at the close on the last trading day of September.
Since 1920, the September Strategy shows a cumulative gain of +299,947% versus +67,801% for buy-and-hold.
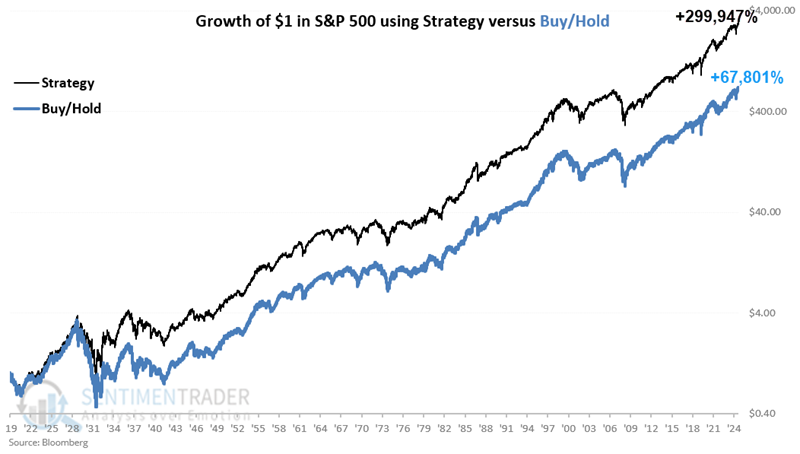
The chart below compares the relative performance of the September Strategy versus buying and holding the S&P 500.
What the research tells us…
For short-term traders, risk is about to ratchet higher according to the calendar. An investor would have achieved a greater return over the long term by avoiding stocks during September, particularly after the third trading day of the month. A strategy to avoid that period has handily beaten buy-and-hold, though without considering trading fees and taxes.