
A straight-up rally to record highs

Key points:
- The S&P 500 has gone virtually straight up since October and hit record highs
- Using tools on the website, we can see how investors reacted after similar price action in the S&P
- The results show some short-term weakness but a strong tendency to rise over the following year
Record highs after a straight-up multi-month rally
The most benchmarked index in the world has gone essentially straight up since October and is sitting at record highs. Bulls couldn't ask for much better.
Whenever we witness a curious pattern, we tend to ask two questions:
- Has this ever happened before?
- If so, how did investors behave afterward?
To answer those questions, we typically use off-the-shelf software or Microsoft Excel. It can get laborious, and you have to be careful about errors.
The SentimenTrader tech team has been working hard on tools so users with the appropriate package can answer these questions themselves. In that vein, they're beta-testing an impressive tool that has already saved me a lot of work.
The new Correlation Pattern Match is a potent tool that allows a user to define any time period for thousands of different indexes, ETFs, or stocks and find all other periods that closely match that price behavior. It's the equivalent of the analogs we've looked at many times over the decades. Now, you'll be able to find them yourself in seconds.
First, we'll discuss the implications of this behavior in the S&P 500. Then, I'll go over the exact process I used to test this on the SentimenTrader site.
What does it mean?
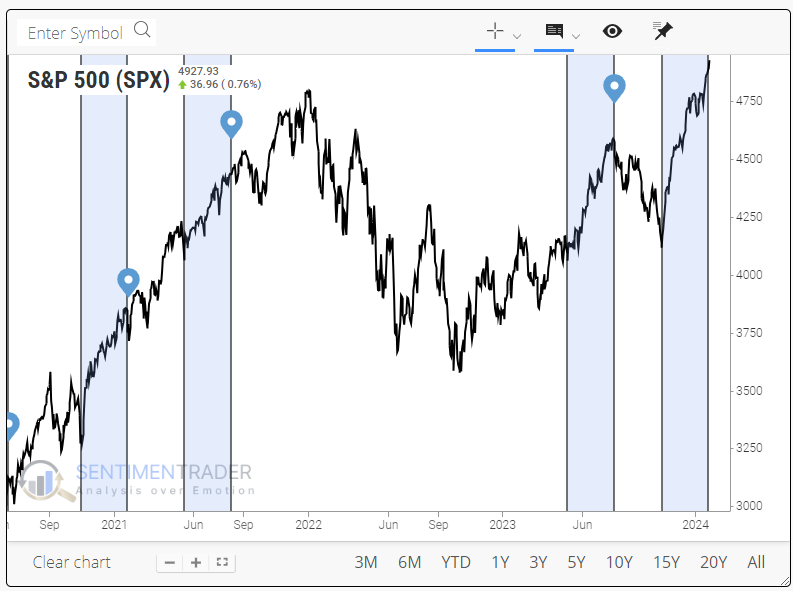
The chart below shows the last few times this pattern was triggered. These are times when the S&P 500 closed at least at a 3-year high, and the past 61 trading days had a +0.95 correlation to the price action we've seen since October 27. Basically, straight-up rallies.
The green arrows and dots show the entry, and the red arrows and dots show one month later.
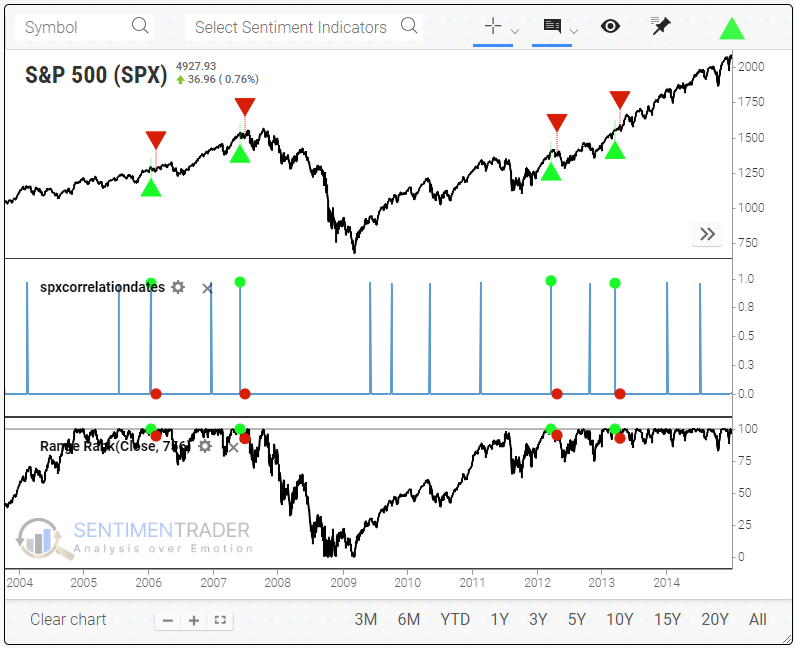
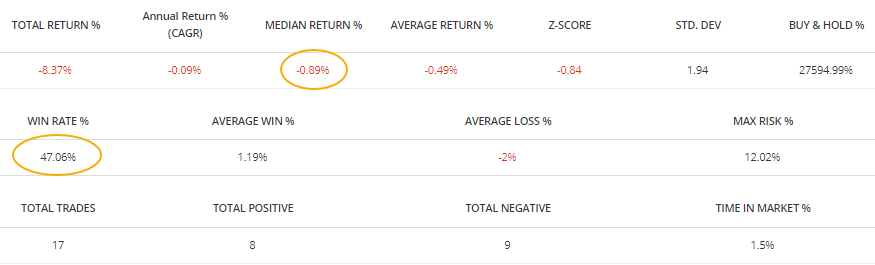
These weren't great times to jump on the rally. Since 1930, the S&P continued to gain 47% of the time (8 winners and 9 losers) over the next month, with a median return of -0.9%.
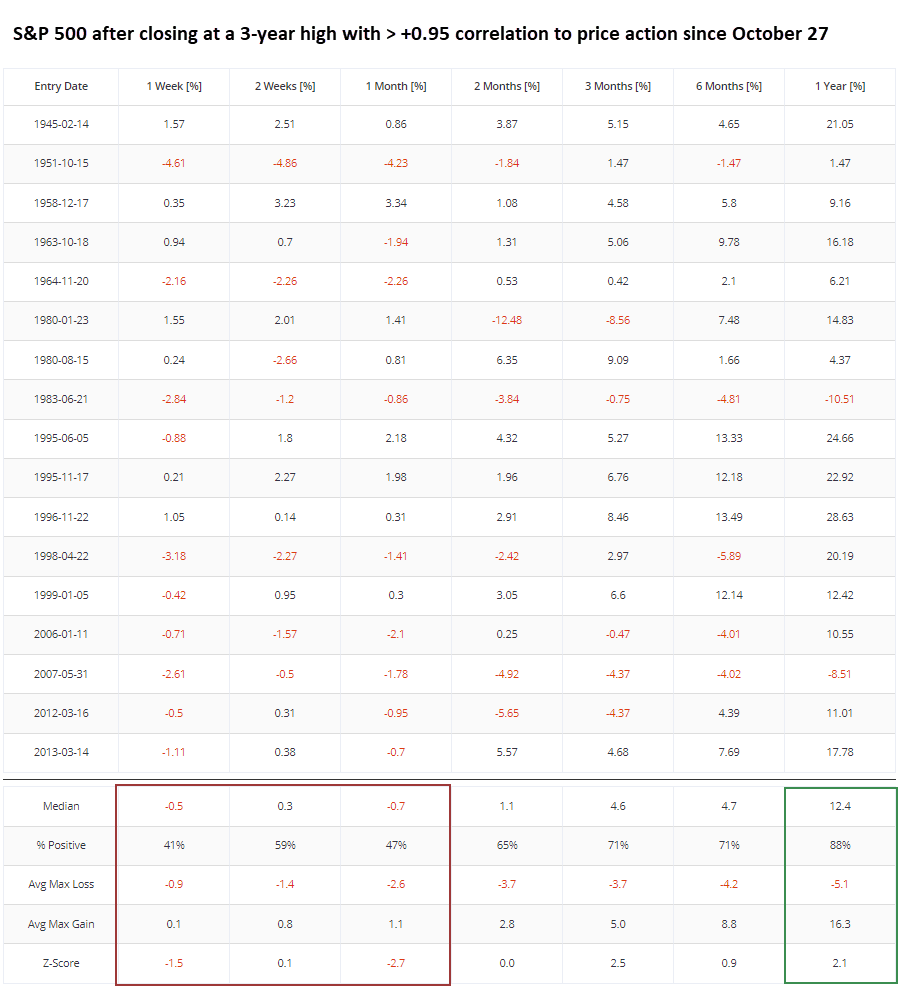
Looking at different Time-in-Market returns, we can see that short-term returns were pretty weak overall but strengthened from three months and beyond. Over the next year, the S&P 500 was positive 88% of the time, with a median return of +12.4%. The two outright failures occurred in 1983 and 2007.
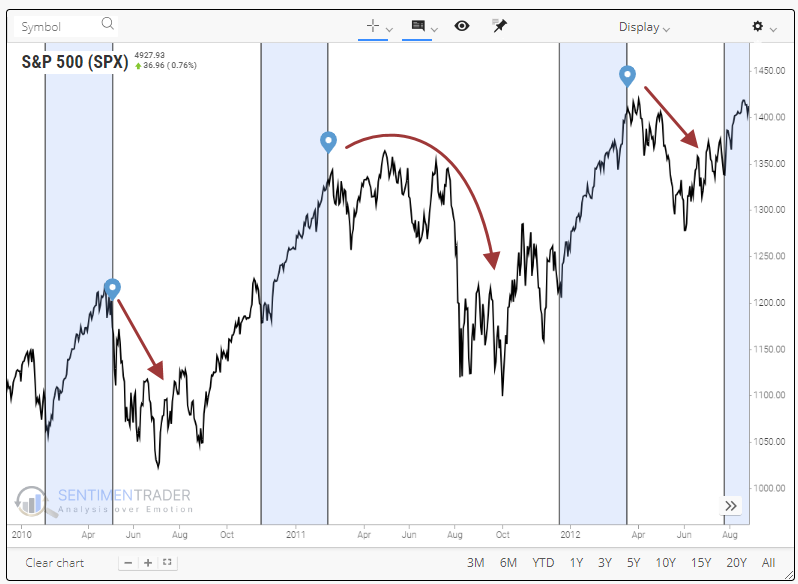
On the correlation chart, we can scroll back and see how these straight-up rallies ended up preceding immediate corrections following the initial rebound off the 2009 market bottom.
How did I do this?
The process below is the exact one I followed to investigate and test the pattern above. When the tool is introduced, click Correlation Pattern Match from the header.

After that, select the following parameters from the input boxes.
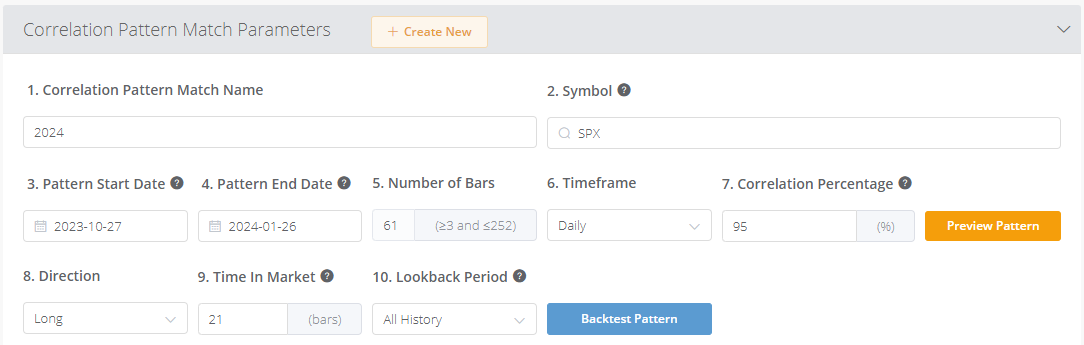
Here are the parameters we'll look for:
- We'll just call this "2024," but you can name it whatever you like.
- We're going to test this on the S&P 500, ticker SPX.
- We will tell it to start looking at the S&P's price action starting on October 27, 2023, the day of the bottom.
- Then, we'll tell it to stop looking at the price action as of January 26, 2024.
- You don't need to do anything; the system automatically calculates the days.
- Don't need to do anything, as we're looking at daily price bars.
- We will change the correlation percentage to 95, meaning that we only want to see price action with a +0.95 correlation to the price action from October 27 through January 26.
From here, you can click the Preview Pattern button, and it will highlight other time frames with a high correlation to the past 61 trading days.
To test this pattern by itself, you can backtest it directly from the tool. We'll just leave the default parameters there and test a long position in the S&P over the next 21 days over all its history when this correlation is triggered. Click the Backtest Pattern button, and the test will run.

When the test is completed, we'll see that the correlation exceeded +0.95 a total of 97 times. Out of those, the S&P continued to rise over the next 21 days 48 times and had an overall median return of -0.15%.
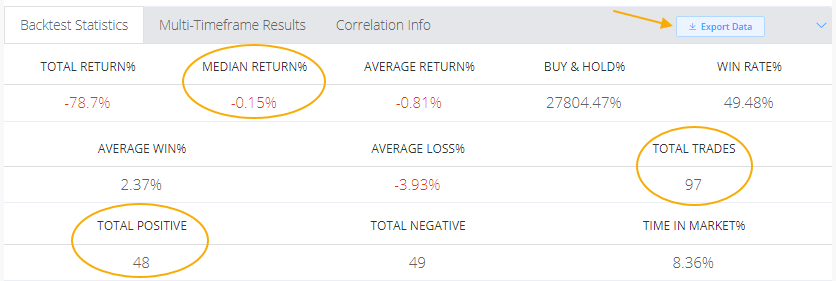
You can also select the Multi-Timeframe Results tab to see a list of all the trades and their returns over various time frames or the Correlation Info tab to see the start/end dates and the correlation figure.
Adding an extra step to the test
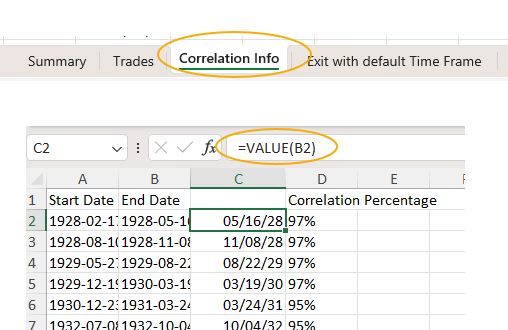
We will have to do some extra work because we want to add a step and test these correlations against 3-year highs. Click the Export Data button to get a CSV (comma-separated value) file with all the historical trade information.
Open that file in Excel or other spreadsheet program and click the Correlation Info tab. Since this is a text file, we must convert them to values to manipulate them how we want. So, insert a column before column C, then in cell C2, type the formula =VALUE(B2). Copy that down all the rows. This will convert the text dates to actual dates recognized by Excel. You may have to format the column to a date system you know.
Now, we need to open a file with trading dates going back as far as we want. I use a file of S&P 500 closing dates, excluding Saturdays. If you cannot access these dates, let us know, and we can provide a historical data file back to 1930.
Open the file with trading dates. We'll start our data in 1930 because many programs have issues with dates before 1930 (they confuse 1928 with 2028, for example). We'll copy the data from columns C-D in the backtest file from above and paste-special-value them into columns E-F in our file with the trading dates. Then, in cell B2, enter the formula in the graphic below and copy it down until the last row. The formula tells Excel to look through all the dates from the correlation test, and if a trading date matches, it will attach the value to that date. Otherwise, it will show a "0."
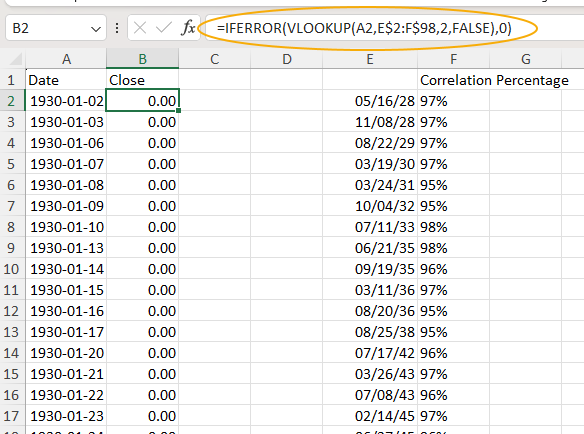
Once that's done, copy and paste-special-values the data in column B to hard-code it, then you can delete columns E-F. You'll want to ensure cell A1 has the text "Date" and cell B1 has "Close." Also, format column A so that the dates are in yyyy-mm-dd format and column B so the values are in number format. Save that file as a CSV file and close it.
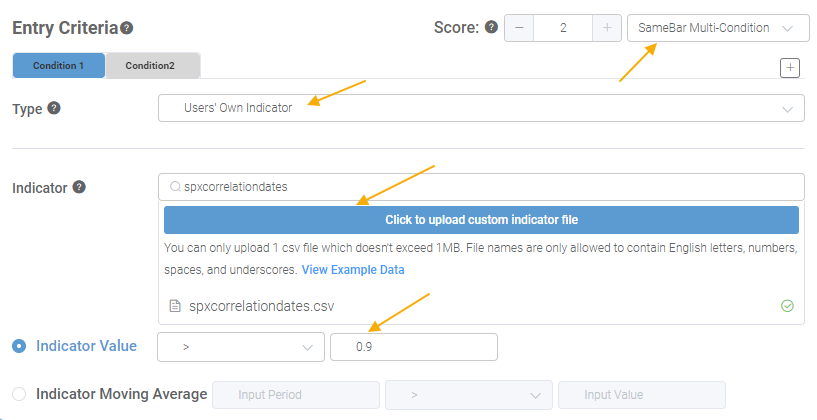
Okay, now we're ready to use Backtest Engine 2.0. Start a new backtest and scroll down to the Entry Criteria section. In the Type box, select Users' Own Indicator and click the button to upload your own data. Select the CSV file you just saved and allow the system to upload the data. When done, choose > 0.9 (or anything less than 0.95) in the Indicator Value fields.
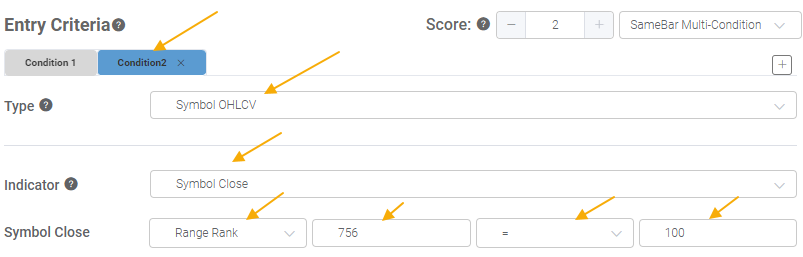
You'll also want to select SameBar Multi-Condition in the Score field, then click the Condition2 tab. This is where we will tell the Engine to look for times when the S&P 500 trades at least at a 3-year high. So, select Symbol OHLCV, Symbol Close, then Range Rank of 756 days equals 100. That means that the S&P is at 100% of its trading range over the past 756 days - in other words, at a 3-year high.
After that, the test is ready to run, so click the Run Backtest button at the bottom and give it some time to crunch all the numbers. You should get the same dates and returns as the study above when it finishes. There may be some differences depending on the data file you used or if the parameters differ.
It might seem like a convoluted process at first. The only reason we're doing it is to be able to use the Backtest Engine to test data it wasn't originally meant to handle. After doing it once or twice, the process speeds up, opening up a very powerful and flexible way to test data. If the Backtest Engine doesn't have a study you'd like to test, uploading your own data usually fixes that issue.
What the research tells us...
Because the most benchmarked index in the world has gone almost straight up for months and recorded multiple record highs, contrarians want to assume we must be headed back down. Sometimes, that's happened. But historically, when price action has been the most similar to the past few months, that hasn't been the case, at least not in any meaningful way. Returns up to a month later were negative but inconsistently.
Notably, the following year was positive after 15 of 17 times when investors pushed S&P 500 stocks as they have since late October. Momentum is a powerful force, which we can see in this test. Times when the S&P managed to go for months with barely a blip and recorded at least a 3-year high to boot showed a strong tendency to show gains over the following year.
You can find out more about Jason at White Oak Consultancy LLC (https://whiteoakconsultancy.com/).