Products
SentimenTrader Trading Tools
‍
Backtest Engine
My Trading Toolkit
Correlation Analysis
Seasonality
Market Prediction
Indicators & Data API
‍
Proprietary Indicators & Charts
Market Data API
Strategies & Scanner
‍
50+ Trading Strategies
Smart Stock Scanner
Smart Option Scanner
Research Reports
‍
Research Solutions
Reports Library
Free Resources
Simple Backtest Calculator
Simple Seasonality Calculator
The Kelly Criterion Calculator
Sentiment Geo Map
Public Research Reports
Education
Sentiment Indicators
Technical Indicators
Pricing
Company
About
In the News
Testimonials
Client Success Stories
Contact
Log inLoginSign up
< BACK TO ALL REPORTS

A steady rise in Technology suggests further upside

Dean Christians
2023-07-25
For only the 11th time in more than 70 years, the S&P 500 Technology sector has avoided a 10-day low for more than 60 trading sessions. Similar win streaks led to impressive gains for Technology and the S&P 500 over medium- and long-term horizons. History suggests the year-to-date winner can continue to outperform.

Key points:

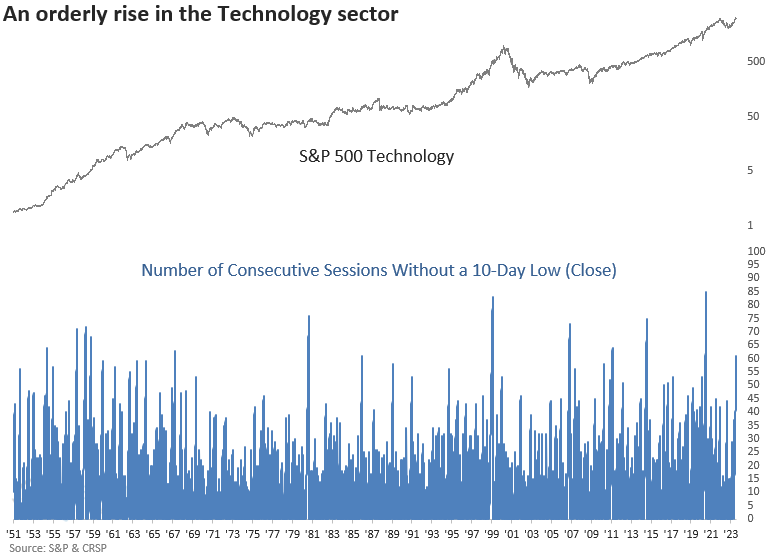
  • The S&P 500 Technology sector has avoided a 10-day low (close) for 61 sessions
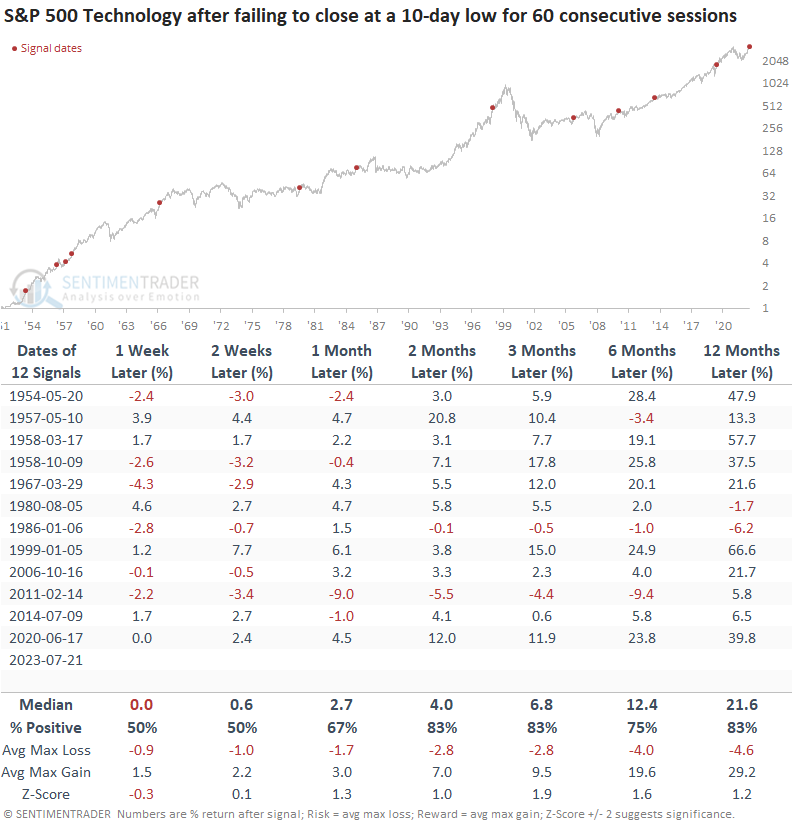
  • After similar win streaks, the sector was higher 83% of the time over the next two and three months
  • A relative comparison versus the broad market suggests Technology will outperform

Should we continue to ride the bullish momentum in Technology?

As the Technology sector continues its bullish run, anxiety among investors escalates. The dilemma for market participants who joined the Technology rebound this year is whether the sector's upward momentum has become excessive, prompting them to assess the possibility of taking profits. For traders who missed the rally, the primary concern is whether to jump on board after witnessing such a substantial price increase.

To limit human emotion that plagues investors of all types, Sentimentrader employs a quantitative approach to research that emphasizes analysis over emotion.

For 61 consecutive sessions, the S&P 500 Technology sector has refrained from closing at a 10-day low, establishing the longest win streak since the post-COVID melt-up and ranking as the 11th most significant count in over 70 years.

Let's assess whether avoiding a 10-day low (close) for 60 sessions foreshadows a bullish or bearish outlook for the Technology sector so we can remove emotion from our decision-making process.

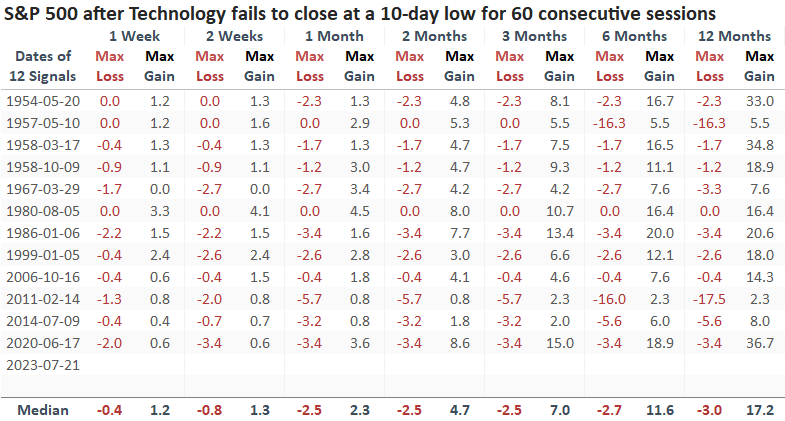
Similar win streaks above the 10-day low preceded additional gains

When the S&P 500 Technology sector avoids a 10-day low (close) for 60 sessions, the bullish price momentum for the group is likely to continue over a medium- and long-term horizon. The best opportunity to add exposure comes in the first few weeks, when the sector shows a coin toss win rate.

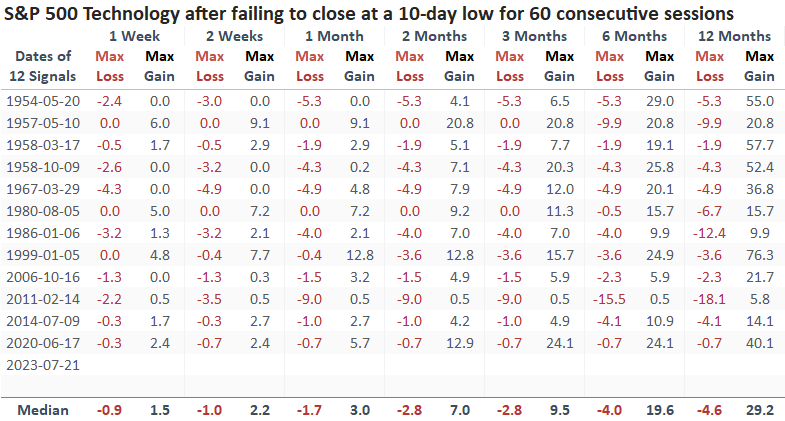
Drawdowns were remarkedly low in the first three months, with only one precedent greater than -6%. Over the next two, three, and six months, the max gain exceeded the max loss in 11 out of 12 instances.

Favorable conditions in the Technology sector bode well for the broad market. Over the next two months, the S&P 500 was higher in all but one case and that instance showed a minimal decline of only -1.3%. The 1957 instance is the only time a signal occurred within the context of a bear market.

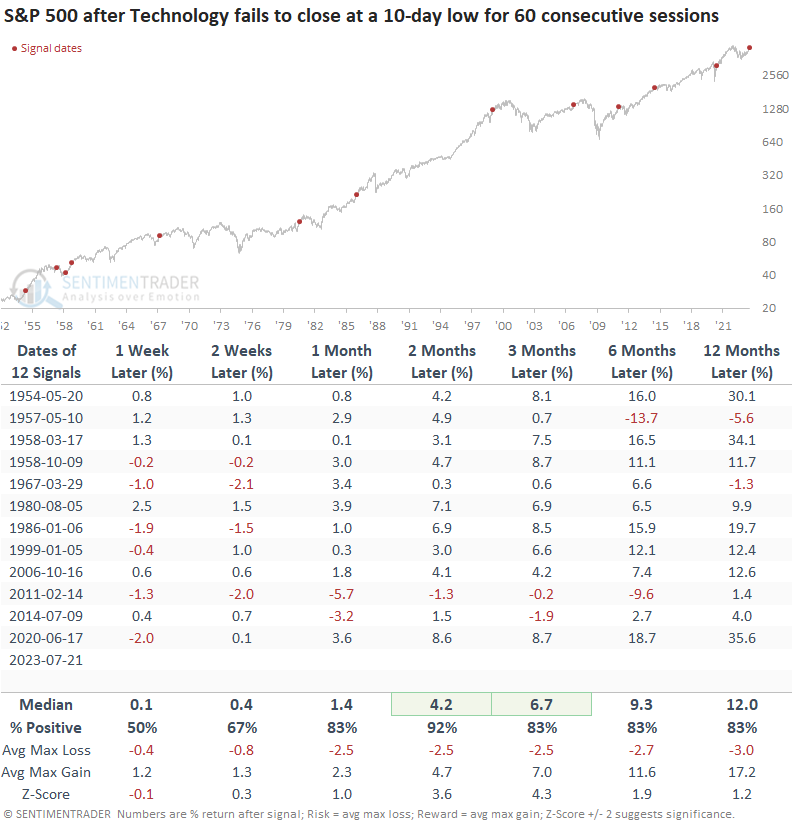
The S&P 500 suffered only one max loss greater than -5% over the next three months. A year later the max gain exceeded the max loss in 10 out of 12 precedents. 

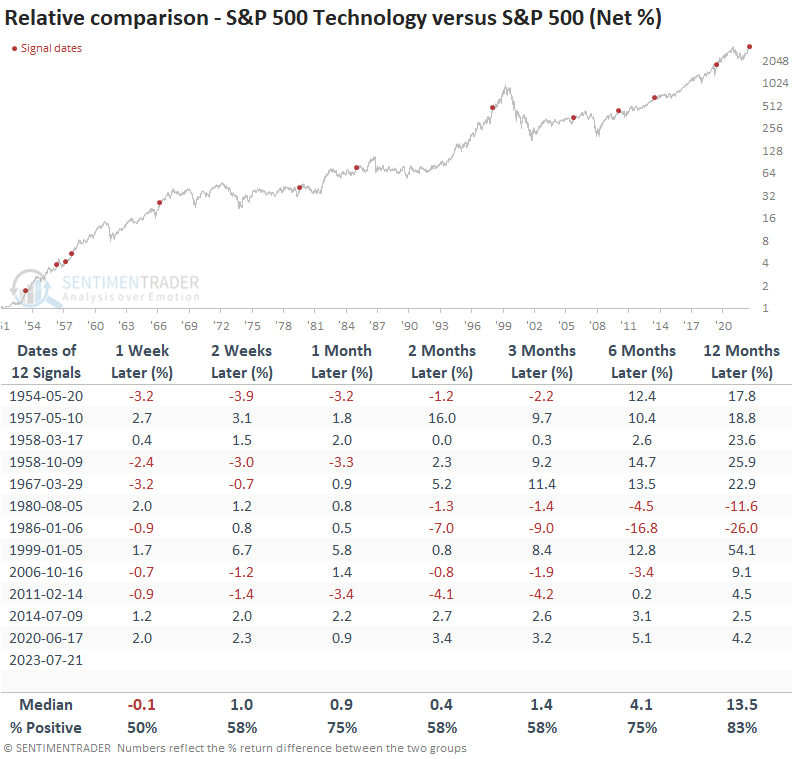
Can Technology continue to outperform?

When I compare the S&P 500 Technology sector to the S&P 500, the potential for Technology to continue outperforming the broad market looks promising, especially over the next 12 months.

What the research tells us...

Over the last 60 sessions, the Technology sector has consistently stayed above a 10-day low (close), reflecting a bull market environment rather than a bear market one. After similar win streaks, the Technology sector was higher 83% of the time over the next two, three, and twelve months. While large-cap stocks delivered excellent returns, investors reaped more significant rewards by favoring the Technology sector over the S&P 500.

PRODUCTS
SentimenTrader
Trading Tools
Indicators & Data API
‍
Strategies & Scanner
‍
Research Reports
FREE
RESOUrCES
Simple Backtest
Calculator
Simple Seasonality
Calculator
The Kelly Criterion
Calculator
Sentiment Geo Map
‍
Public Research Reports
‍
Education
Sentiment Indicators
‍
Technical Indicators
‍
Pricing
Bundle pricing
‍
FAQ
‍
Announcements
‍
COMPANY
‍
About
‍
In the News
‍
Testimonials
‍
Client Success Stories
CONTACT
‍
General Inquiries
‍
Media Inquiries
‍
Financial Professionals Inquiries
‍
© 2026 Sundial Capital Research Inc. All rights reserved.
Setsail Marketing
TermsPrivacyAffiliate Program
Risk Disclosure: The information and tools provided are for research and analytical purposes only and are not intended as investment advice. Market analysis involves uncertainty, and outcomes may differ from expectations. Users should conduct their own due diligence and consider their individual circumstances before making any financial decisions. Past performance is not necessarily indicative of future results.

Hypothetical Performance Disclosure: Hypothetical performance results have many inherent limitations, some of which are described below. No representation is being made that any account will or is likely to achieve profits or losses similar to those shown; in fact, there are frequently sharp differences between hypothetical performance results and the actual results subsequently achieved by any particular trading program. One of the limitations of hypothetical performance results is that they are generally prepared with the benefit of hindsight. In addition, hypothetical trading does not involve financial risk, and no hypothetical trading record can completely account for the impact of financial risk of actual trading. for example, the ability to withstand losses or to adhere to a particular trading program in spite of trading losses are material points which can also adversely affect actual trading results. There are numerous other factors related to the markets in general or to the implementation of any specific trading program which cannot be fully accounted for in the preparation of hypothetical performance results and all which can adversely affect trading results.

Testimonial Disclosure: Testimonials appearing on this website may not be representative of other clients or customers and is not a guarantee of future performance or success.