
A smaller proportion of stocks are maintaining medium-term uptrends

Key points:
- A Risk-Off Composite Model member that assesses medium-term price trends triggered a warning
- Similar market breadth conditions saw the S&P 500 struggle over the following two months
- Although the Risk-Off Composite Model previously issued a warning, the signal count rose to 80%
Does the narrowing participation suggest a correction or sector rotation?
When market participation dwindles, one of two scenarios typically unfolds: indexes decline or move sideways. In that latter case, the phenomenon represents an internal correction or, more commonly, known as sector rotation.
The broad market occasionally rallies during these sector rotation phases as the advancing stocks maintain a disproportionate weighting in the index, influencing price upward. This trend has become more common in recent months and is evident now as the "magnificent-7" gains traction-a scenario I detailed in my report; a relative trend composite score for the Nasdaq 100 surged by a historic amount.
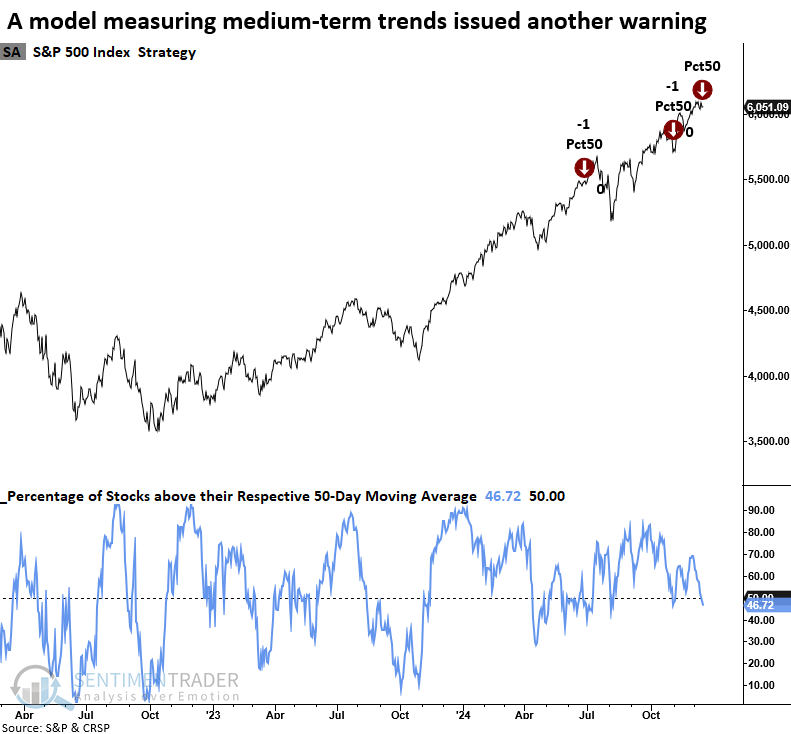
With sector rotation now favoring technology-oriented mega-cap stocks over the average stock, short-term market breadth indicators like those in my Composite Risk-Off Model have triggered several signals. The latest to fire a warning identifies periods when fewer than 50% of S&P 500 stocks reside above their respective 50-day average, with the index hovering near a high.
The chart below illustrates that the S&P 500 has continued to advance despite these warnings, indicating that the participation problem is likely nothing more than sector rotation.
Comparable market breadth conditions preceded negative returns
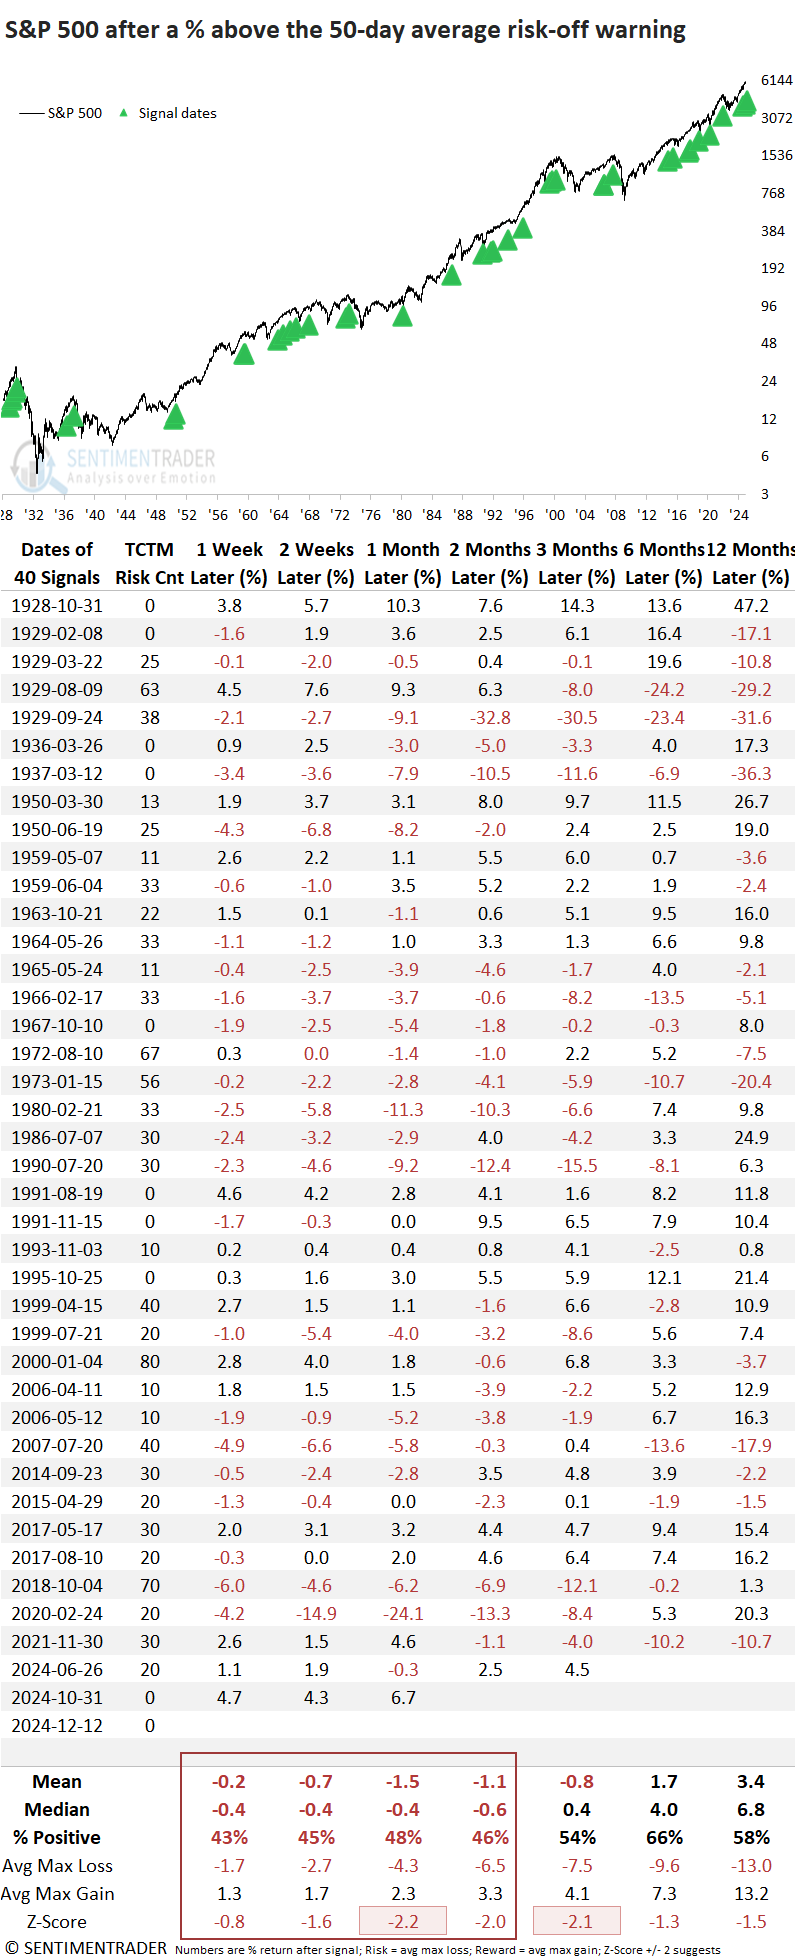
Following a percent above the 50-day average risk-off warning, the S&P 500 experienced a challenging period, especially over the next few months. Furthermore, risk outweighed reward across all time frames except the one-year mark, and that ratio was barely positive.
As indicated in the second column, the TCTM Composite Risk Warning Model has no active signals, suggesting that long-term measures of market participation do not confirm the percent above 50-day warning. Consequently, I would not expect a significant correction.
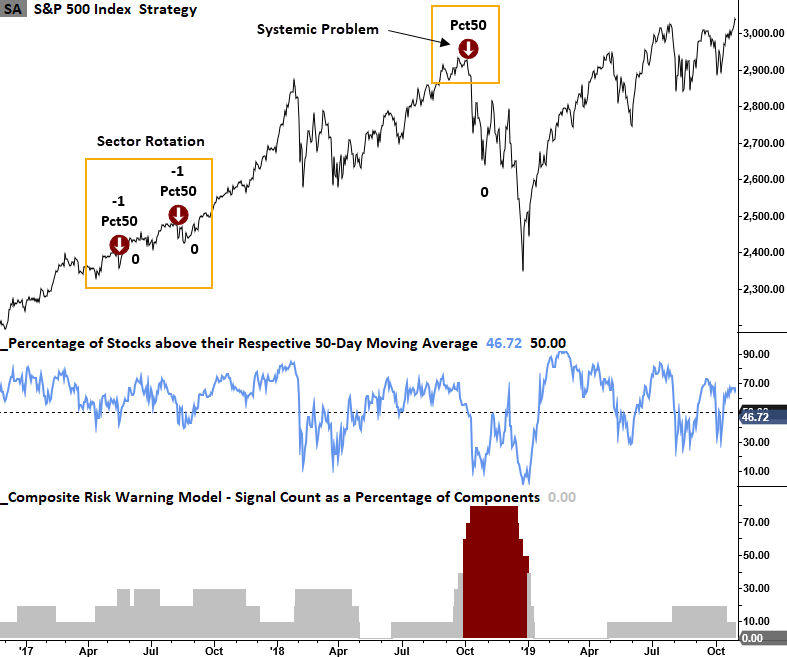
Multiple signals in 2017 provide an example of the sector rotation scenario that can occur in an uptrend rather than a systemic problem, like in the fall of 2018 when the percent above the 50-day average warning coincided with a signal count of 70% from the TCTM Risk Warning Model.
A split-market breadth backdrop
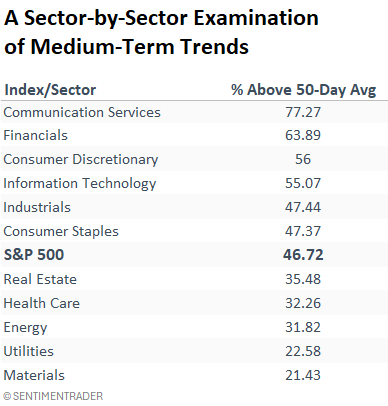
As highlighted in previous reports, defensive and commodity-focused sectors are the main drivers of the deterioration in market breadth. Cyclical growth and value groups, though softening, display more favorable trends.
As long as the cyclical groups remain resilient, the sector rotation scenario will unlikely evolve into a broader systemic issue.
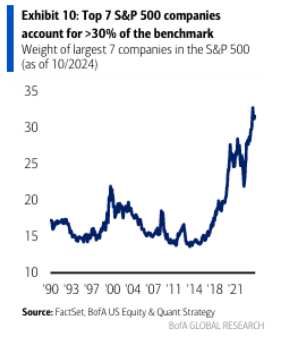
One likely cause influencing the all-or-nothing market breadth environment
According to data from Bank of America, the top seven S&P 500 companies account for over 30% of the benchmark weighting. This significant concentration helps explain the recent market breadth backdrop whereby declining stocks outnumbered advancers for nine consecutive days as the S&P 500 hovered within 1% of its peak.
These stocks are influencing index performance and market breadth indicators in an unprecedented manner.
What the research tells us...
A member in the Risk-Off Composite Model triggered a new warning when fewer than 50% of the stocks in the S&P 500 closed above their respective 50-day averages, highlighting a medium-term trend participation problem. Similar signals have preceded challenging periods for the S&P 500, with weakness particularly pronounced in the first few months. However, with the TCTM Composite Risk Warning Model signal count currently residing at zero, an imminent threat of a significant correction seems unlikely. It's more probable that the dwindling participation indicates sector rotation, a common occurrence in uptrends where investors move from one group to another as the business cycle matures or new innovations take hold.