
A Simple Trend Following Strategy using Sentiment

Key points
- I highlighted in a recent note that investor sentiment is showing few signs of the type of froth we would expect to see before a top
- A review of indicators found one more iteration of a key sentiment trend that falls firmly on the favorable side of the weight of the evidence ledger
- As it turns out, AAII sentiment can serve as a decent trend-following indicator
AAII Bears peak then turn down
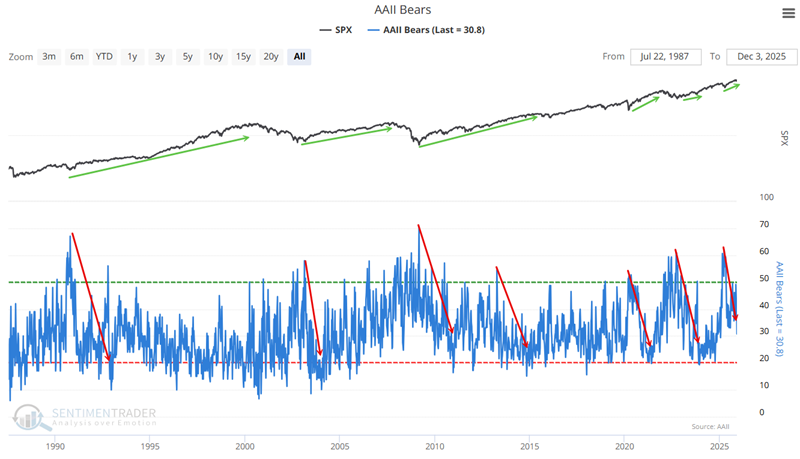
The chart below displays the weekly readings of AAII Bears. Note the general tendency for the figure to rise as the market declines and vice versa.
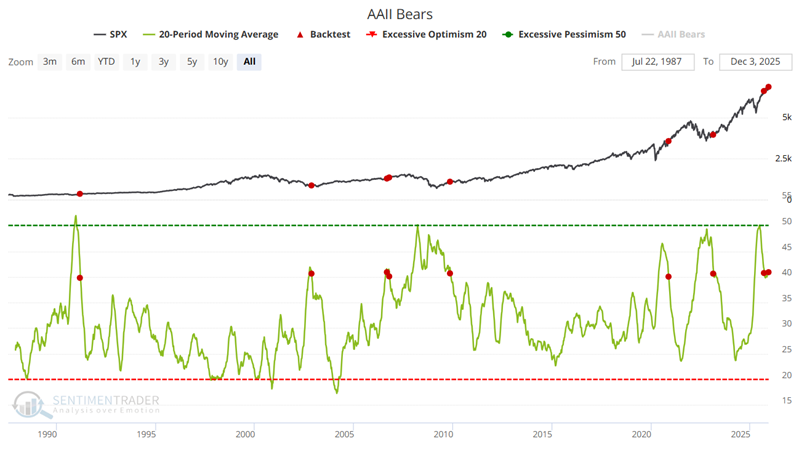
One problem with this visual approach is in determining "how high is high?" and, more importantly, "when to actually commit money to the market?" Let's apply a trend-following approach. The chart below highlights all weeks when the 20-week moving average of AAII Bears crosses below 41%, including overlapping signals. Note that a signal was detected on September 17th. After that, the 20-week moving average rose back above 41% and then dropped back below that level on December 3rd.
The table below summarizes the S&P 500 index performance following the dates highlighted in the chart above.
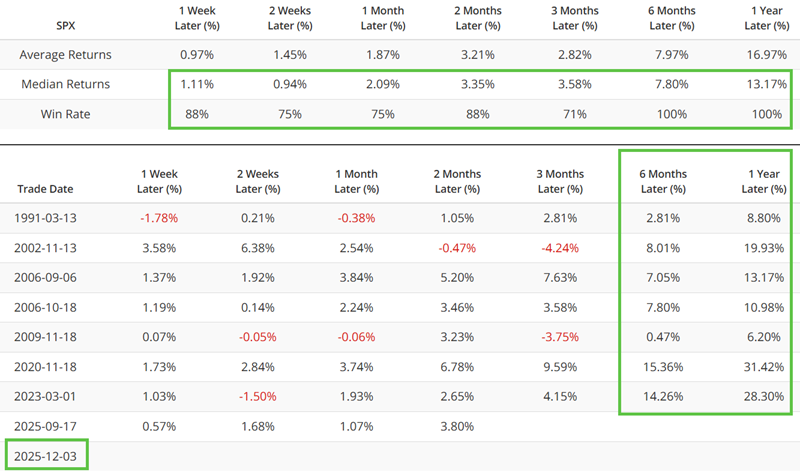
Will we definitely see higher stock prices in the year ahead? Not at all. No historical backtest ever guarantees future performance. That said, based on historical results, the recent signals suggest that there is a long way to go before sentiment reaches the type of frothy level we would typically expect to see before a bull market top. In the meantime, the results above add weight to the bullish side of the weight of the evidence ledger.
Now, let's highlight a way to build the signal above into a more systematic approach using BacktestEdge. Note that the test detailed below is available in BakctestEdge under Analysts Backtest (Public).
Formulating a Strategic Approach
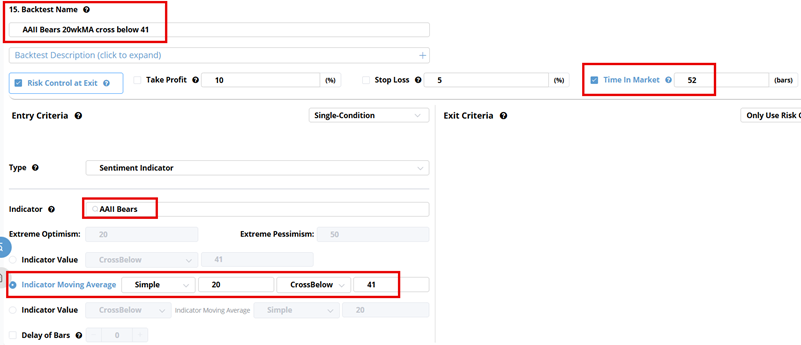
For our test in BacktestEdge, we will apply a 20-week moving average to the weekly AAII Bears indicator. Note that to make this a weekly "strategy" (such as it is), the data is updated at the end of the week, even though the AAII data comes out mid-week. A favorable signal occurs when the 20-week average drops below 41%. To test this as a hypothetical strategy, we will apply a simple and arbitrary 52-week holding period.
Two technical notes:
- Because AAII values come out once a week (typically on Wednesday), BacktestEdge treats this as a weekly indicator. Thus, signals do not occur until the end of the week (NOT on the date that the AAII value is published). This is slightly different from the Backtest Engine 1.0 test shown above, which notes the signal on the date AAII numbers are published. Thus, the test above recognizes a signal on September 17th, and the strategy below recognizes the same signal at the end of the week on September 19th.
- The test below uses a 52-week (i.e., 1-year) holding period. No new signals that occur within the 52 weeks after an existing signal are recognized. Thus, the strategy below recognizes the signal on September 19th, but not the one that happened in the first week of December.
The green up arrows in the chart below highlight weeks when the 20-week moving average for AAII Bears dropped below 41%. The red down arrows appear 52 weeks after the preceding green arrow.
The "strategy" here is to "buy" stocks after bearish sentiment has peaked above a certain level and then reversed lower, then to sell stocks one year later. Please note that I am not necessarily recommending that anyone adopt this approach as a standalone trading strategy. It is ideally used as part of a larger "weight of the evidence" approach.
The screenshot below displays the key inputs for adding this simple method to Backtest Engine 2.0.
Examining the Results
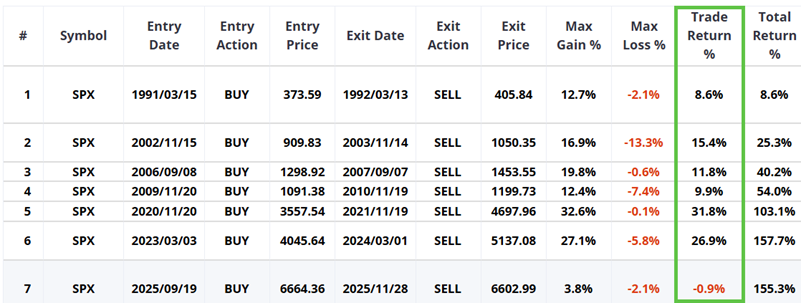
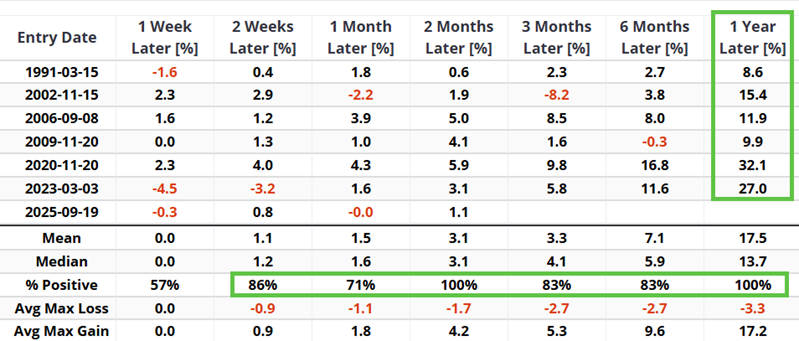
The table below displays the hypothetical results on a signal-by-signal basis. It is fair to point out that the sample size is relatively small, so no assumption should be made that results will be the same ad infinitum into the future. Nevertheless, the small sample size is also a byproduct of the fact that "peak fear" in the stock market (fortunately) doesn't occur very often.
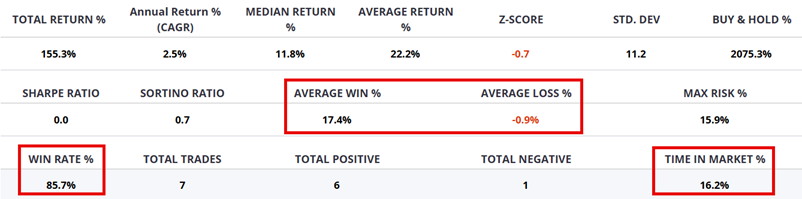
The table below summarizes the results from the hypothetical trades listed above.
To get a sense of what it would be like to actually make the trades, the chart below displays the hypothetical equity curve achieved by taking the trades listed above (assuming a long position in an S&P 500 index fund such as SPY, VOO, or IVV).
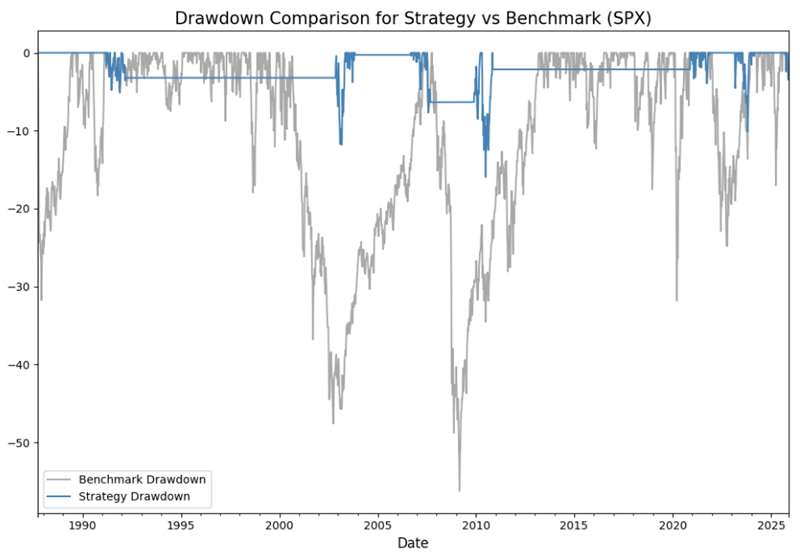
Overall, the equity curve above trends nicely from lower left to upper right (LLUR, as I like to call it). However, in analyzing equity curve charts, it is essential to note periods of volatility and downside action, and ask, "Can I sit through that?" Note that the November 2002 signal generated a one-year gain of 15.4% BUT first experienced a decline of -13.3%. An individual who could not sit through that size of a decline would not have reaped the benefit of the signal.
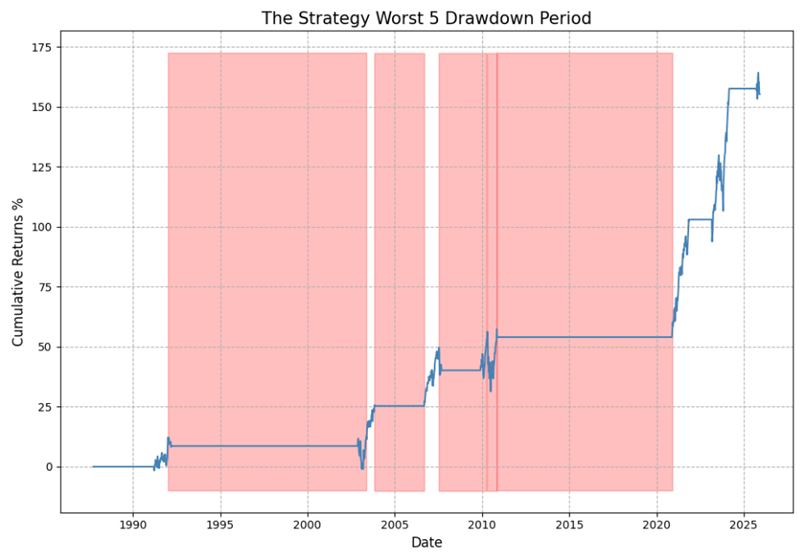
While a 13%+ drawdown may seem daunting, let's put it in perspective. The chart below displays the hypothetical drawdowns for the "strategy" (blue line) versus the drawdown for a buy-and-hold approach (grey line).
The table below puts some numbers to the equity curve shown above. One key metric (in this analyst's opinion) is the % Positive. High win rates across various time frames are a key to successfully utilizing a given strategy. The more erratic the results, the harder it is to stay disciplined. The more consistently high the percentage of positive outcomes across time frames, the easier it is to adhere to a strategy.
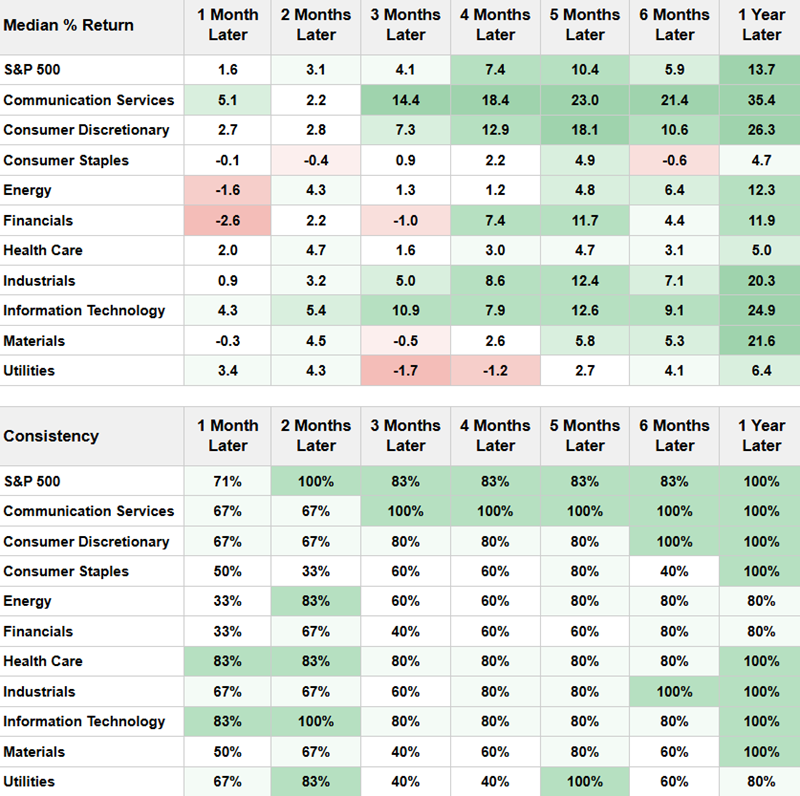
For those seeking to outperform market returns (i.e., the S&P 500 index), the table below presents results for the S&P 500 index sectors. Investors looking to be more aggressive might consider a position in Consumer Discretionary (XLY), Technology (XLK), Materials (XLB), or Industrials (XLI) instead of SPY, etc.
What the research tells us…
Extremes in investor sentiment are a significant indicator that the market is nearing a meaningful peak or trough. However, acting during peak fear is another thing altogether. And sometimes acting during peak fear is not a good idea, as bear market bottoms can involve unexpectedly sharp declines at the end. The approach presented here involves waiting for a period of peak fear to occur, then abate, and entering the market only after signs of a reversal (i.e., declining fear) appear. Is the stock market sure to be higher in September 2026 than it was at the time of the latest signal in September 2025? It is impossible to predict. Nevertheless, the method detailed above suggests that investors give the bullish case the benefit of the doubt.