
A Simple Model to Track the Long-Term Trend in Interest Rates

Key points:
- Interest rates can trend in one primary direction for long periods of time (think decades)
- Understanding whether the current trend is up or down can have important implications for stock market and personal finance-related decisions
- Several simple indicators do a very good job of helping investors to identify the current primary trend in interest rates objectively
- The JK Interest Rate Trend Model is designed to answer one question: "Are interest rates in a long-term rising or falling trend right now?"
NOTE: I am working with our programming team to add a variety of my own indicators/models to the website. The model detailed in this note is referred to as the JK Interest Rate Trend Model (JIRTM). This model is not currently on the website, but I hope to add it in the near future. Because it is extremely long-term in nature, it is unlikely to generate a new signal in the foreseeable future, so I have decided to write about it now rather than wait for its official addition to the website. This ridiculously simple model combines two long-term trend measures to designate the current long-term trend for interest rates as rising or falling (or, on occasion, no trend). Note that the model is NOT an attempt to "predict" the future trend, nor any impending trend change. Fortunately, because long-term interest rate trends can last for decades, knowing the trend today is valuable.
Interest rate measure #1: 120-month exponential average
For testing purposes, we will use month-end historical data for the yield on 10-year treasury notes (ticker TNX, or $TNX). A rise in TNX means a rise in interest rates (or yield), and a decline in TNX means a decline in interest rates.
The first long-term measure we will consider is simply the yield on 10-year Treasury notes relative to its 120-month exponential moving average. As we see in the chart below, interest rates tend to move in very long-term waves, typically rising or falling for decades at a time.
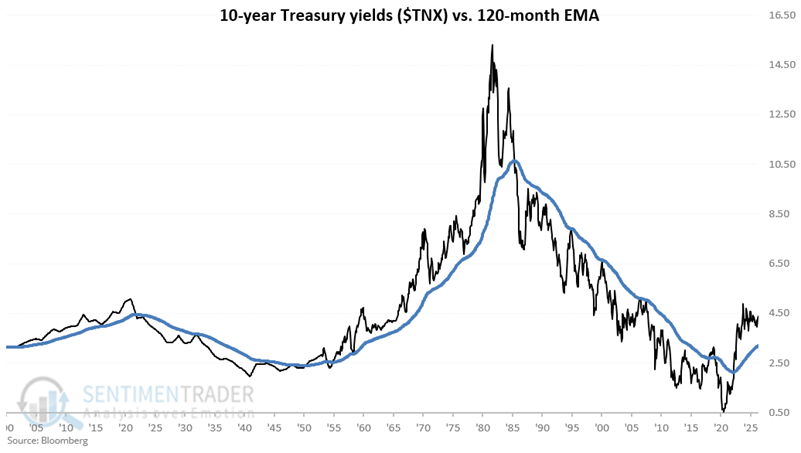
Above, we see five "waves. Rates rose from 1900 to the 1920s. From there, rates trended lower into the 1940s, before drifting sideways into the 1950s. Yields then rose sharply over the next 30 years, finally peaking above 15% in 1981. By the time the next downtrend ended in March 2020, TNX had plummeted to just south of 0.40%. Over the last six years, rates have moved back into an uptrend, currently around 4.4%.
While not perfect, the 120-month EMA has captured the bulk of these trends. While it offers no specific predictive value, for 120+ years it has been a valuable tool in answering the question, "What is the trend in interest rates right now?" And as we have seen, the primary trend changes very infrequently.
Another way to visualize this is to subtract the latest 120-month EMA from the latest month-end TNX reading.
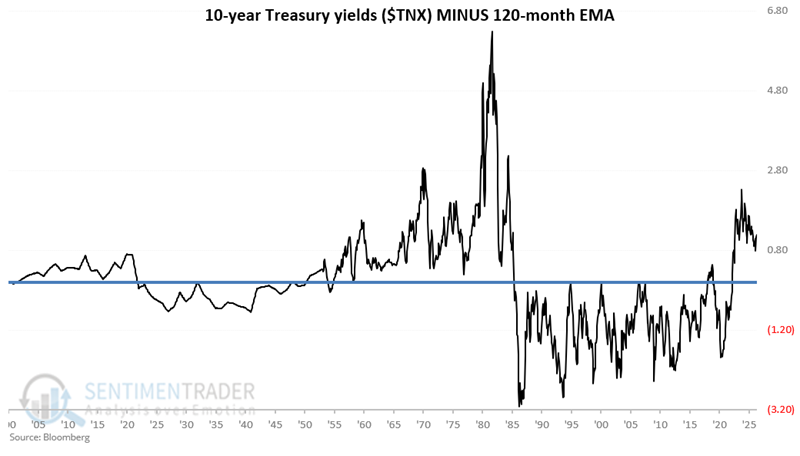
Positive readings indicate that TNX is above its 120-month EMA (i.e., interest rates are in a long-term rising trend), and negative readings indicate that TNX is below its 120-month EMA (i.e., interest rates are in a long-term falling trend).
How well does this admittedly rudimentary approach capture rate trends?
- The black line in the chart below shows the cumulative gain or loss in yield points during months when the 10-year yield closed the previous month above its 120-month EMA
- The blue line in the chart below shows the cumulative gain or loss in yield points during months when the 10-year yield closed the previous month below its 120-month EMA
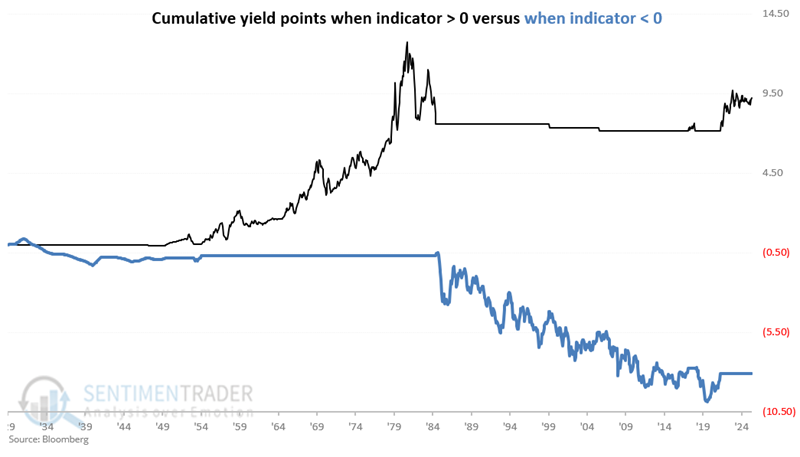
The chart above starts at the end of 1929 to be directly comparable to the next measure discussed.
Interest rate measure #2: 360-month rate-of-change versus 120-month exponential average
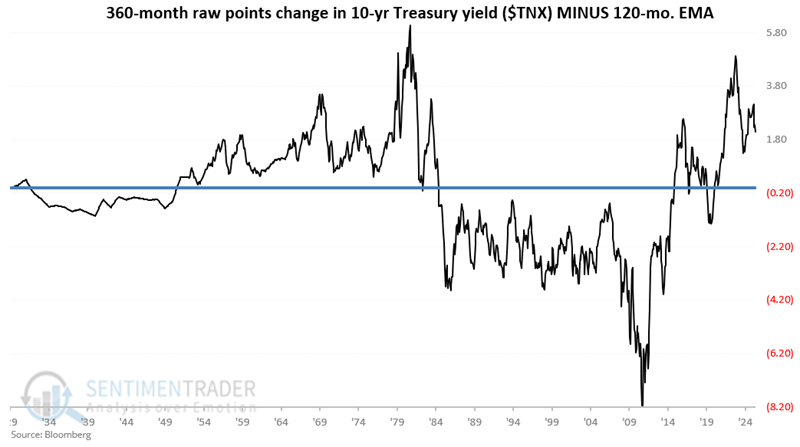
As if a raw 120-month EMA isn't "long-term enough," let's get even a little more extreme. The chart below shows the raw change in 10-year yields over the last 360 months (i.e., 30 years), along with its 120-month moving average.
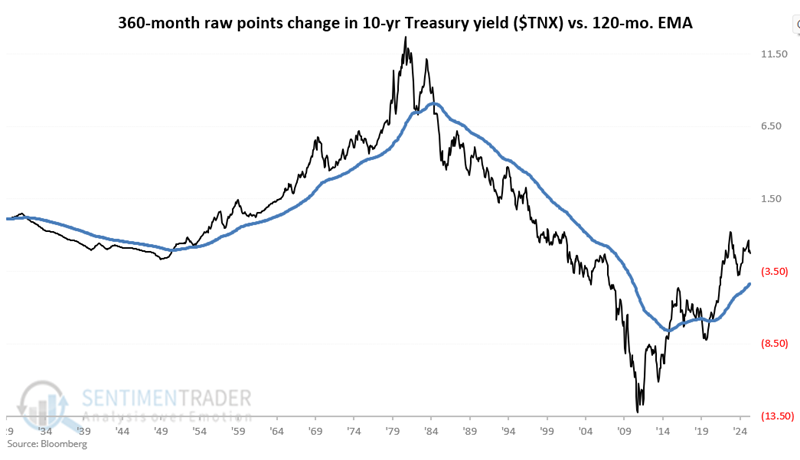
We next subtract the 120-month EMA from the raw 360-month change in TNX. Positive readings indicate a rising rate trend, and negative readings indicate a falling rate trend.
How well does this (also admittedly rudimentary) approach capture rate trends?
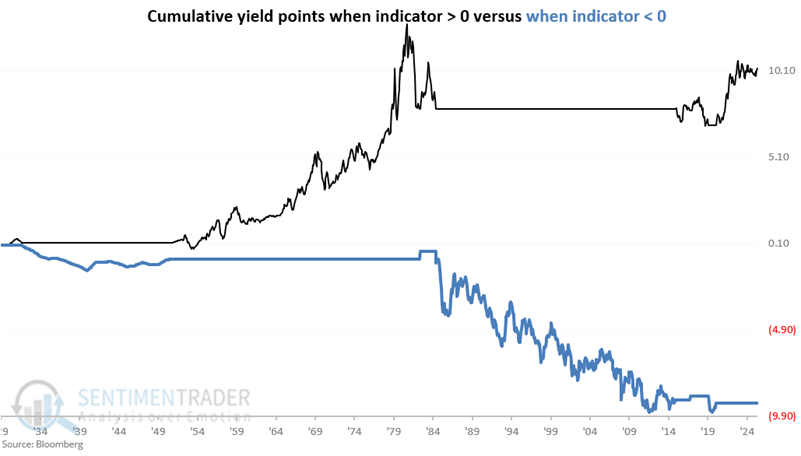
- The black line in the chart below shows the cumulative gain or loss in yield points during months when the 360-month change in the 10-year yield closed the previous month above its 120-month EMA
- The blue line in the chart below shows the cumulative gain or loss in yield points during months when the 360-month change in the 10-year yield closed the previous month below its 120-month EMA
Combining the two measures to create the JK Interest Rate Trend Model (JIRTM)
Now let's look at the end of each month since 1929 to see if the two measures detailed above are "rising" or "falling." If a measure is above its 120-month EMA, we will give it a value of +1. If a measure is below its 120-month EMA, we will give it a value of 0.
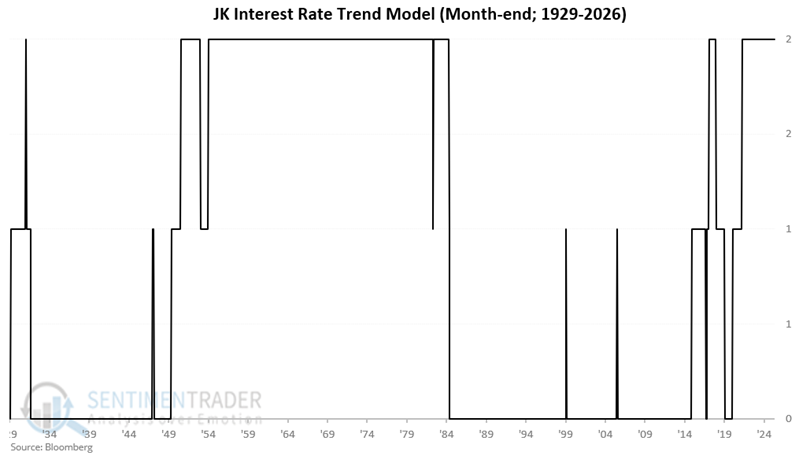
If we put the two together into a model titled JK Interest Rate Trend, it can read +2, +1, or 0 at the end of each month.
+2 = Interest rates are in a rising trend
+1 = The trend is mixed
0 = Interest rates are in a declining trend
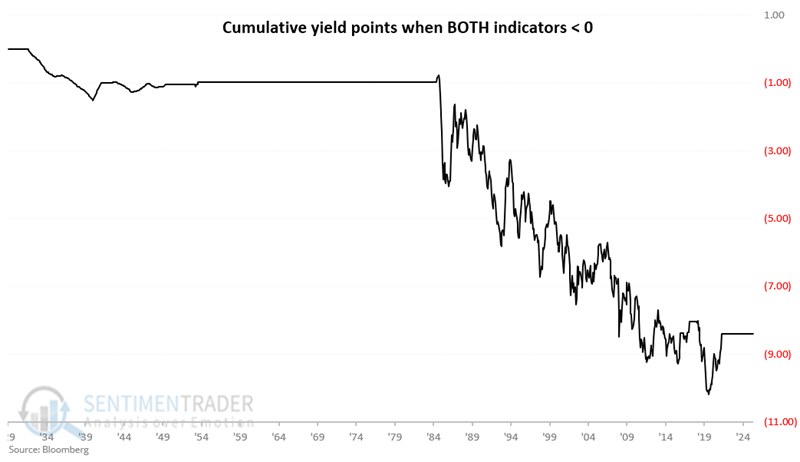
The chart below shows the cumulative change in yield points when the combined model = 0.
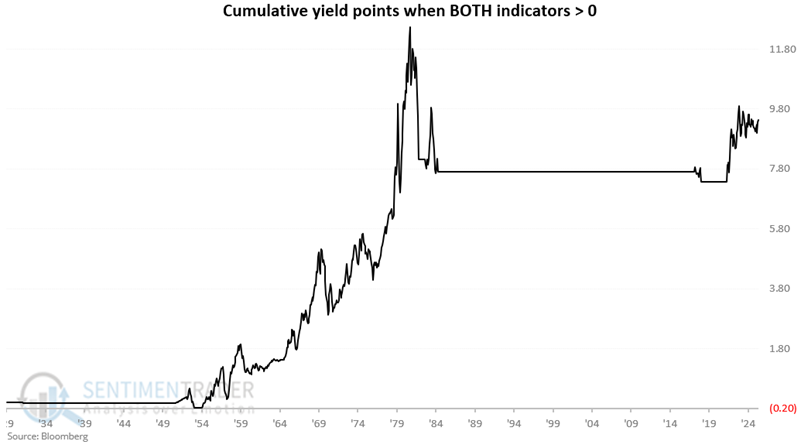
On the flipside, the chart below shows the cumulative change in yield points when the combined model = +2
Lastly, the chart below shows the cumulative change in yield points when the combined = +1 (i.e., one indicator is favorable and the other is unfavorable).
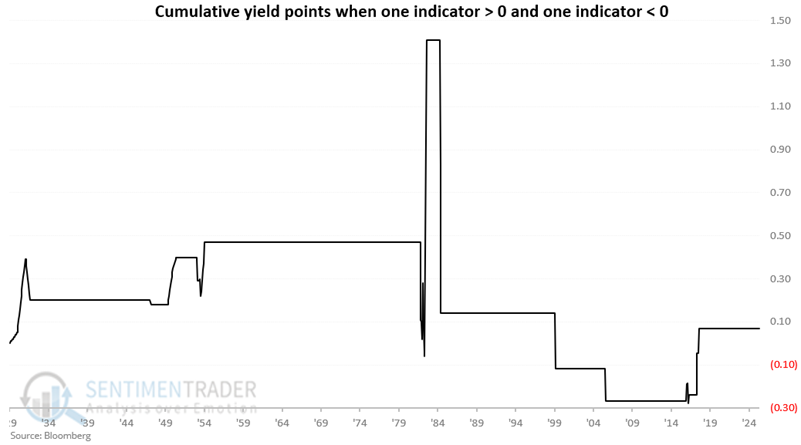
Putting the readings of 0 and +2 together
The chart below shows the month-end readings for the JK Interest Rate Trend Model since December 1929.
So, how well does the JIRTM keep us on the right side of the interest rate trend? For reference, the chart below shows the raw cumulative change in interest rates since 1929.
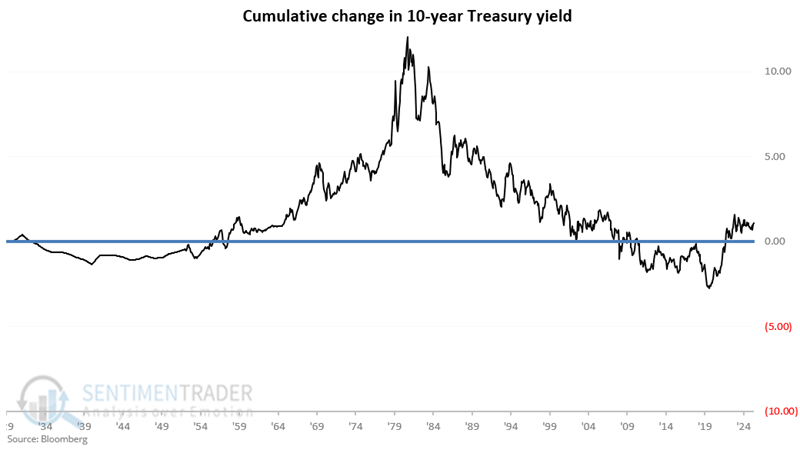
Technically, one could plausibly claim that interest rates are "essentially unchanged" over the past 97 years, rising from 3.29% in December 1929 to 4.39% at the end of April 2026. But that claim would clearly belie the actual up-and-down activity that took place "along the way."
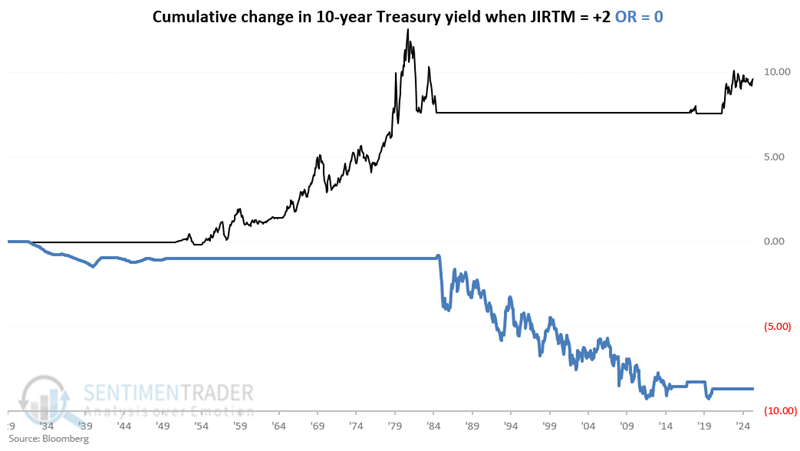
The next chart displays the total cumulative yield points captured when the JK Interest Rate Trend Model = +2 (black line) and the total cumulative yield points captured when the JK Interest Rate Trend Model = 0 (blue line).
Finally, the black line in the next chart shows how well the JK Interest Rate Trend Model captured interest rate changes. This value is arrived at as follows:
(Total cumulative yield points captured when JK Interest Rate Trend Model = +2) MINUS (Total cumulative yield points captured when the JK Interest Rate Trend Model = 0)
The blue line shows the raw change in 10-year treasury yields over the past 97 years.
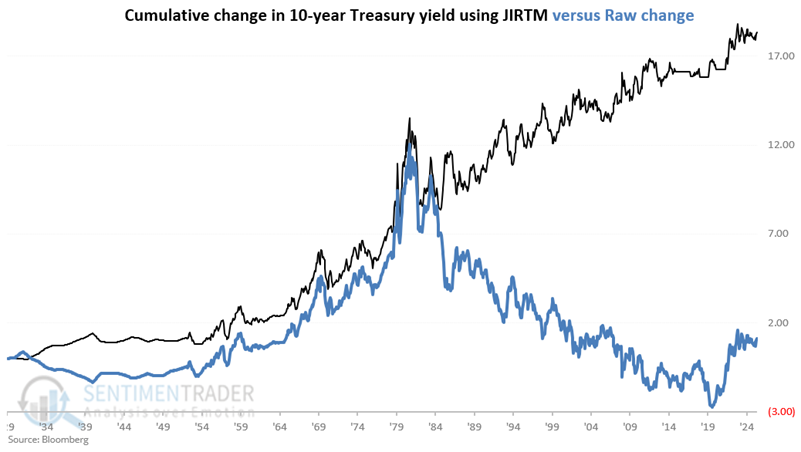
From December 1929 through April 2026, the JIRTM "gained" a total of 18.34 yield points, versus a raw change in TNX of +1.10 yield points.
Translating Model signals to the bond market
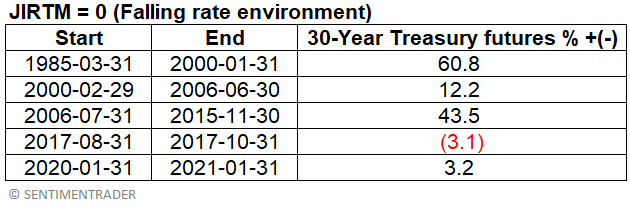
The key takeaway is that rising interest rates translate into lower bond prices, while falling interest rates translate into higher bond prices. Nowhere is this more true than in the 30-year Treasury bond market. Longer-term bonds are more sensitive to interest rate changes than shorter-term bonds, and treasury securities are a pure play on interest rates since they theoretically entail no credit risk. 30-year Treasury bond futures started trading in the late 1970's, so let's look at hypothetical gains and losses by looking at futures price action during periods when the JIRTM was at 0 (falling rate environment, which should be favorable for bond prices) and at +2 (rising rate environment, which should be unfavorable for bond prices).
The first table below shows the percentage change in the price of 30-year T-Bond futures (using continuous contract data) during periods when the JK Interest Rate Trend Model was equal to 0, i.e., interest rates were deemed to be in a "falling" trend.
The table below shows the percentage change in the price of 30-year T-Bond futures (using continuous contract data) during periods when the JK Interest Rate Trend Model was +2, i.e., when interest rates were deemed to be in a "rising" trend.
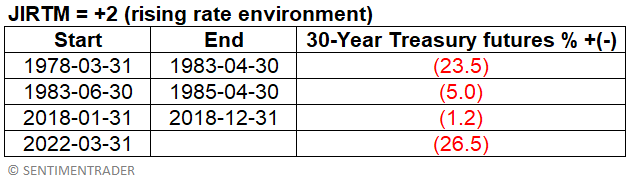
As of April 30, 2026, the JK Interest Rate Trend Model remains at +2. Thus, according to this model, we are in a long-term rising rate environment (and remember, I'm just the messenger).
What the research tells us…
The JK Interest Rate Trend Model does not "predict" future interest rate trends per se. Its sole purpose is to designate the trend "right now" as up (JIRTM reading of +2), down (JIRTM = 0), or indeterminate (JIRTM = +1). Fortunately, major trend changes in interest rates tend to occur only once every several decades. So, if the trend is up (or down) at the end of this month, chances are good that the trend will still be up (or down) in the next month. For now - and for better or worse - the JK Interest Rate Trend Model is solidly at +2, indicating that a primary rising interest rate environment remains in force for now