
A Simple, Long-Term Approach to Handling the "Weight Issue"

Key points:
- The S&P 500 Index is capitalization-weighted, thus movements by the index are more heavily influenced by the stocks with the largest capitalization
- The S&P 500 Equal-Weight Index gives equal weight to each of the 500 constituent stocks
- This note details one approach to help investors decide whether to favor the cap-weighted or equal-weighted version.
Tracking the ebb and flow between cap-weighted and equal-weighted indexes
Let's start by invoking:
Jay's Trading Maxim #40b: No style, sector, index, or asset EVER holds a permanent advantage.
The relationship between the standard S&P 500 index and the S&P 500 Equal-Weight index is a prime example. The black line in the top clip in the chart below shows the absolute performance of the SPDR S&P 500 ETF Trust (ticker SPY), and the blue line shows the absolute performance of the Invesco S&P 500 Equal Weight ETF (ticker RSP). The bottom clip illustrates the performance of RSP in relation to SPY.
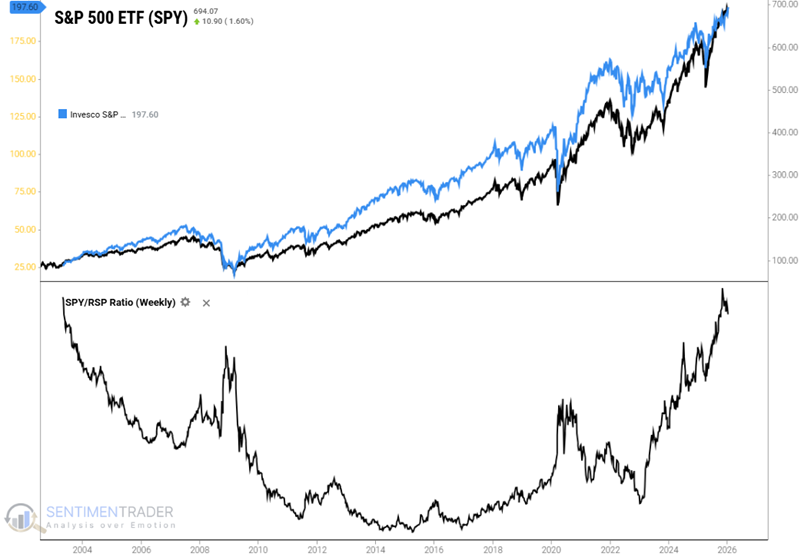
We can note three things from the charts above:
- SPY and RSP performance in the top clip are correlated enough that many will assume there isn't much difference between the two
- But, the bottom clip reveals a series of longer-term "ebbs and flows" between the two indexes
- The rising black line in the borrom clip tells us that SPY has been significantly outperforming RSP in recent years
Monthly SPYRSP Momentum
Some people will ride the trend (favoring the cap-weighted SPY) until they think they see a legitimate reversal. Others will attempt to "pick the top" and anticipate the inevitable reversal that favors equal-weight over cap-weighted.
For our purposes, the approach detailed below is essentially a "trend-following" one.
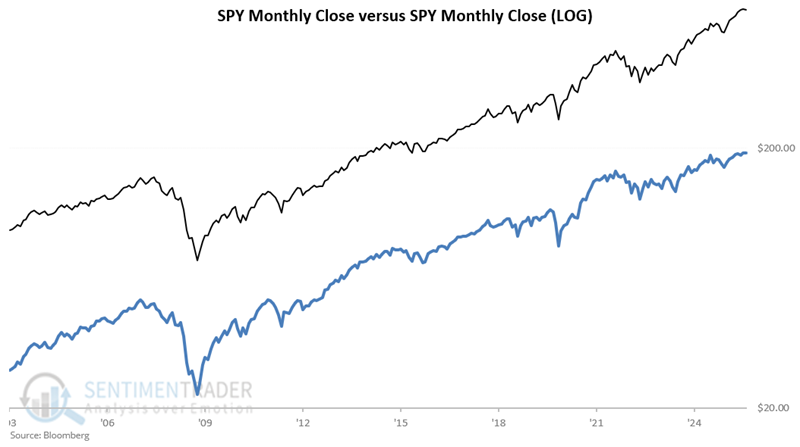
To begin, the chart below displays the price action (using month-end closing price data only) for SPY (black line) and RSP (blue line). From this comparison, it is difficult to identify any real difference, despite the significant relative swings shown in the chart above.
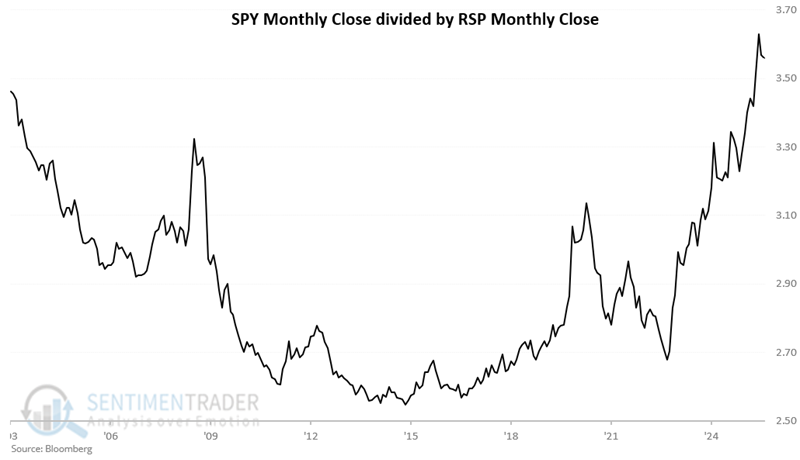
To gain a better understanding of the relationship, the following chart simply divides the monthly closing price of SPY by the monthly closing price of RSP. We see that trends can whipsaw, but overall, typically tend to last for lengthy periods of time.
To smooth out the trend, we will add a twelve-month exponential moving average, as shown in the following chart.
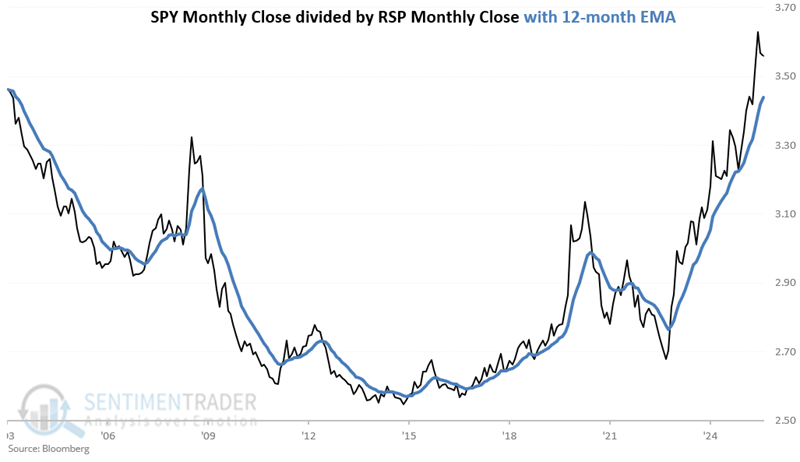
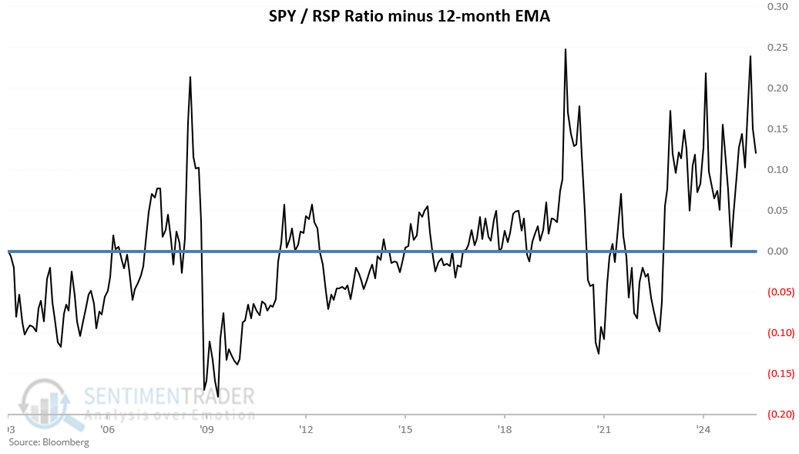
Finally, for the chart below, we subtract the twelve-month exponential average at the end of each month from the actual SPY/RSP ratio at that time. Heretofore, I will refer to this value as SPYRSP Momentum.
Positive readings in SPYRSP Momentum mean that SPY is outperforming, and negative readings mean that RSP is outperforming.
Now let's look at how the indexes perform when SPYRSP Momentum is positive or negative.
SPY and RSP performance when SPYRSP is positive versus negative
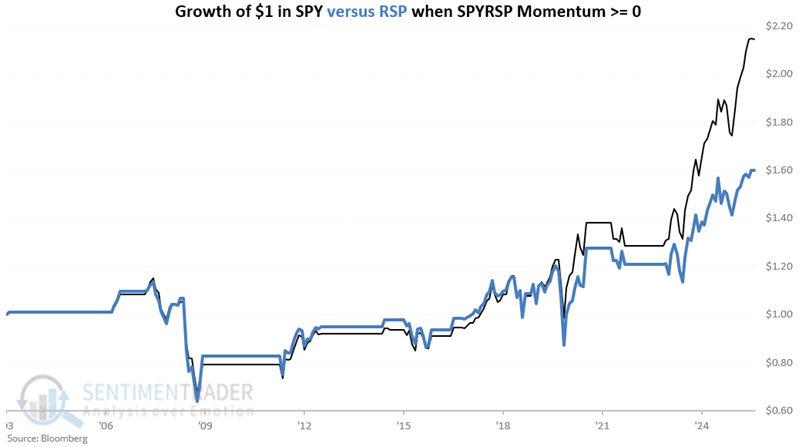
The chart below displays the hypothetical growth of $1 in SPY versus RSP when SPYRSP Momentum is positive. $1 in SPY grew to $2.14, while $1 in RSP grew to $1.60.
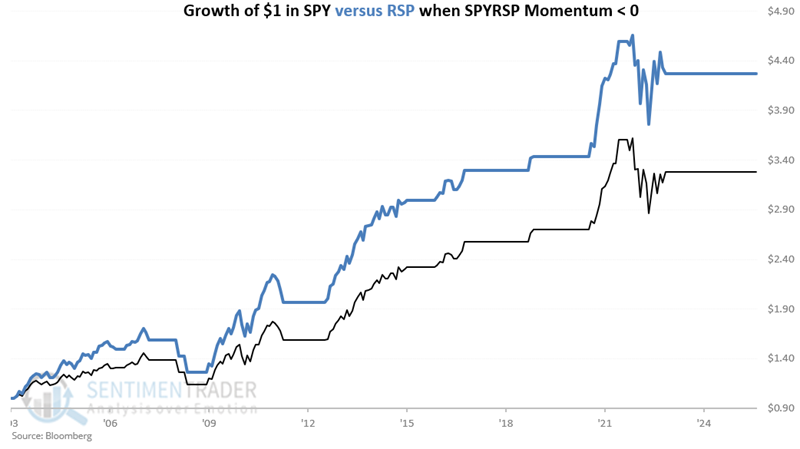
The chart below displays the hypothetical growth of $1 in SPY versus RSP when SPYRSP Momentum is negative. $1 in SPY grew to $3.28, while $1 in RSP grew to $4.27.
Combining the two regimens into a switching strategy
Now let's consider the following strategy:
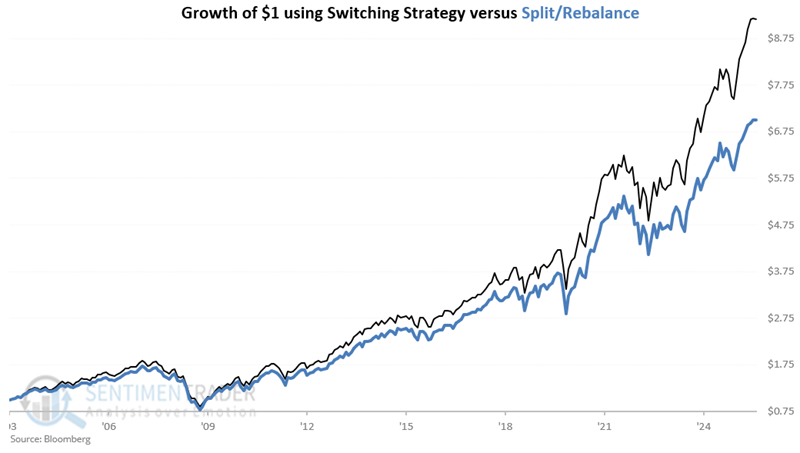
- When SPYRSP Momentum is greater than zero, we will hold SPY, and when SPY RSP Momentum is negative, we will hold RSP. To have something to compare it to, we will also follow the following Split/Rebalance approach:
- We start with 50% in SPY and 50% in RSP; at the end of each calendar year, we will rebalance to 50% in SPY and 50% in RSP
The chart below displays the hypothetical growth of $1 invested using the Switching Strategy versus the Split/Rebalance strategy.
The chart below divides the black line from the line above (Switching Strategy growth of $1) by the black line (Split/Rebalance growth of $1). Notice the long-term tendency for this measure of performance to trend from "lower left to upper right."
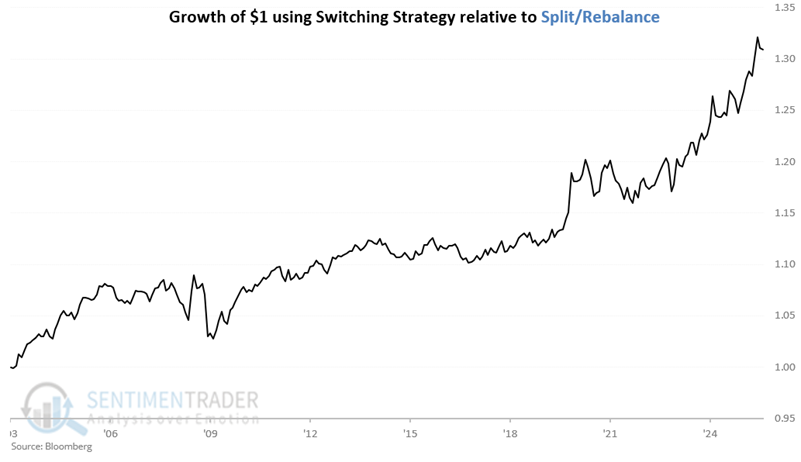
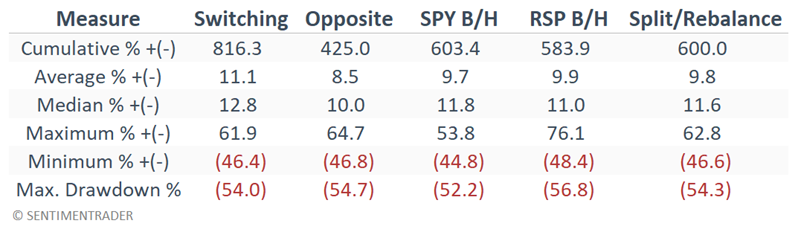
Comparing performance results
In the table below, we compare results for the following:
- Switching Strategy: Hold SPY when SPYRPS Momentum is positive and RSP when negative
- Opposite: Hold RSP when SPYRPS Momentum is positive and SPY when negative
- SPY Buy/Hold: Buy and hold SPY
- RSP Buy/Hold: Buy and hold RSP
- Split/Rebalance: Split between SPY and RSP 50/50, then rebalance to 50/50 at the end of each year
SPYRSP Momentum has been positive since the end of March 2023. Since that time, SPY has gained 67%, while RSP has gained 33%. It will likely be some time before SPYRSP Momentum falls back into negative territory.
What the research tells us…
Momentum is a real thing in the financial markets. For any number of reasons, a given index or security will outperform another index or security, and then see that trend completely reverse at some point in the future. Alert (and patient) investors can take advantage of this tendency in many cases by simply riding the current top performer. This has historically been the case regarding the relationship between the cap-weighted and equal-weighted S&P 500 indexes. The cap-weighted S&P 500 index has significantly outperformed equal-weight in recent years. Will this trend continue, or are we due for a reversal? Who can predict? Regardless, history suggests that a disciplined, trend-following approach to tracking this relationship can be very beneficial.