
A simple approach to weighted versus unweighted S&P 500

Key points:
- The S&P 500 Index is a capitalization-weighted index, so the largest companies have the most influence on the index
- The S&P 500 Equal-weighted Index assigns equal weight to each stock
- A simple switching technique between these two may offer long-term investors an edge
Seasonal switching between cap- and equal-weight indexes
Many investors have come to favor a buy-and-hold index strategy, and none are more popular than the S&P 500.
One weakness of that approach is that the largest companies in the index can assert an undue influence. Switching between the traditional capitalization-weighted index and its equal-weighted version, depending on the calendar, can add to returns.
The strategy below aims to offer a potential edge to investors who decided to devote some of their capital to an S&P 500 Index buy-and-hold approach. For testing purposes, we will use the SPDR S&P 500 ETF Trust (SPY) to track the S&P 500 Index and the Invesco S&P 500 Equal Weight ETF (RSP) to track the S&P 500 Equal Weighted Index.
There is not much to the strategy; there are only two steps:
- From June 1st through October 31st hold SPY (SPX cap-weighted index fund)
- From November 1st through May 31st hold RSP (SPX equal-weighted index fund)
Results for November through May
The chart below displays the cumulative percentage return for RSP and SPY if both are held only from November through May since RSP's inception in 2003.
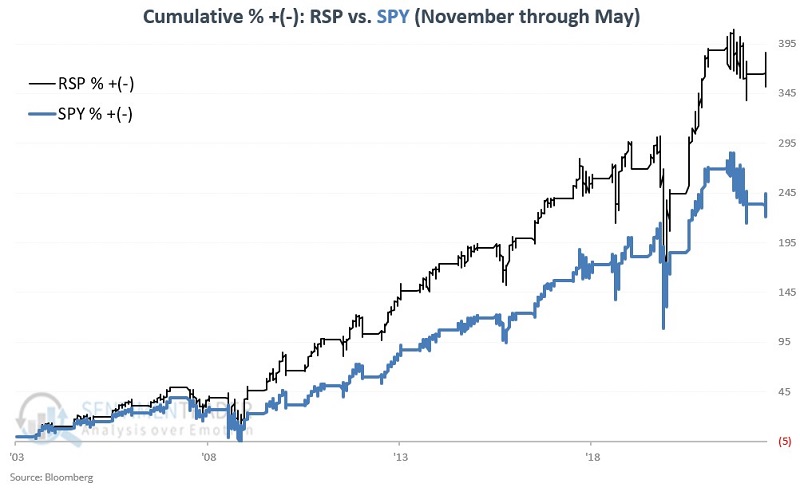
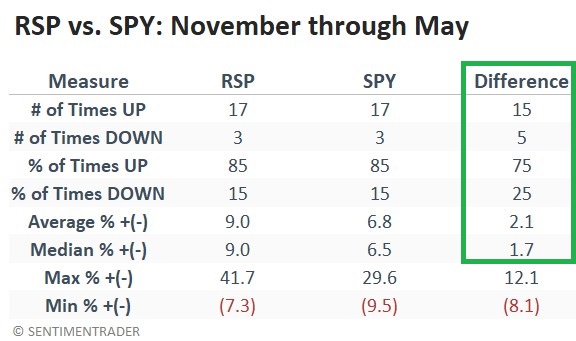
Both RSP and SPY showed a gain 85% of the time but RSP had a significantly higher average and median return. RSP outperformed SPY 75% of the time.
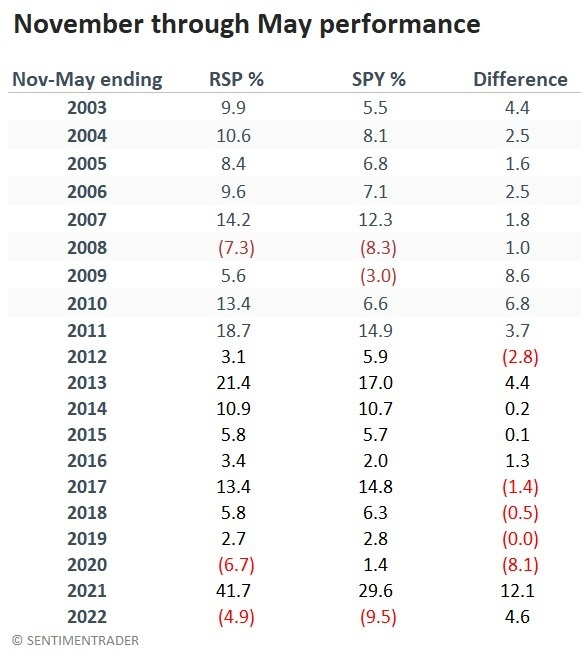
The table below shows individual year returns.
Results for June through October
The chart below displays the cumulative percentage return for RSP and SPY if both are held only from June through October.
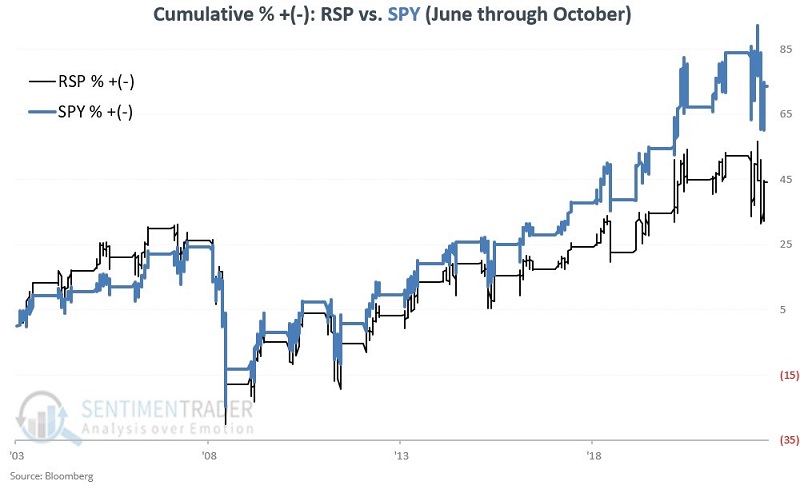
SPY showed a gain 80% of the time and had a higher average and median return. SPY outperformed RSP 65% of the time.
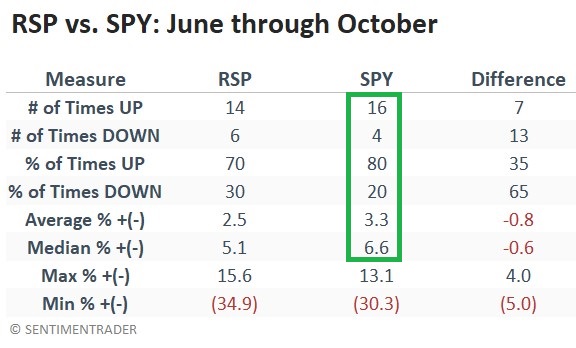
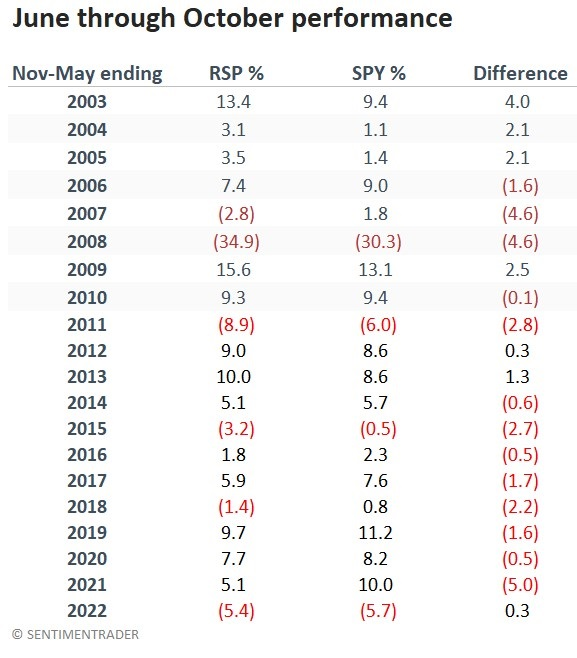
The table below shows individual year returns.
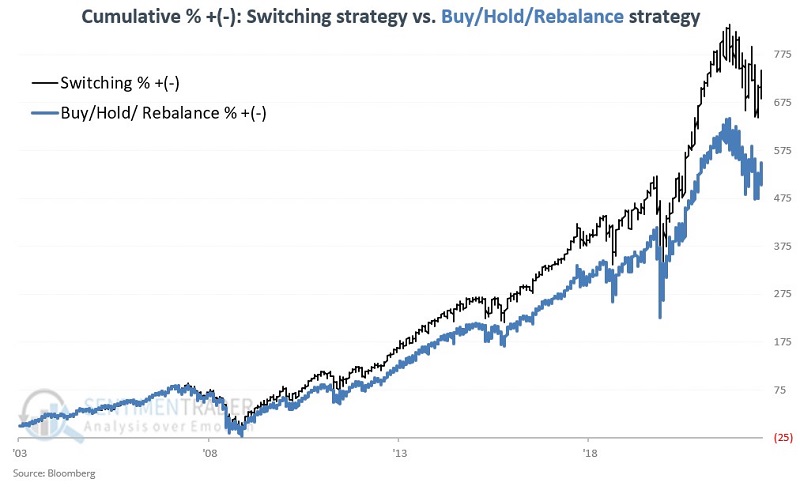
Combining the two periods into one strategy
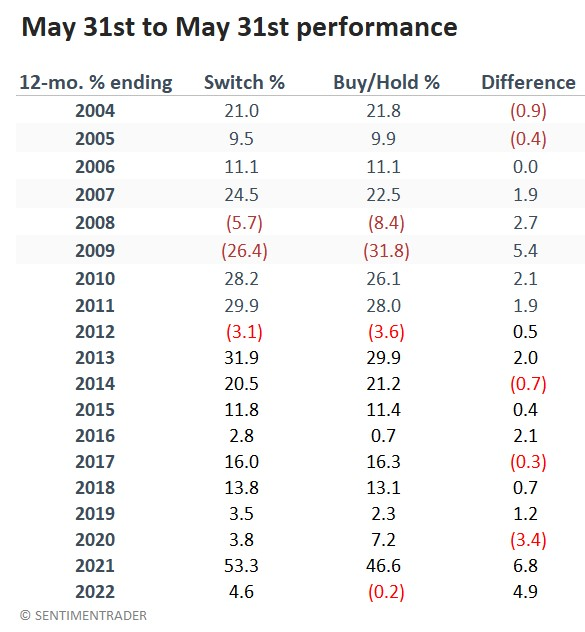
The switching strategy involves two trades per year, switching to SPY on May 31st and switching to RSP on October 31st.
Let's take a look at the full strategy results. As a benchmark, we will also track a strategy that holds 50% each in RSP and SPY. This strategy will rebalance to 50/50 at the end of each year.
The switching strategy showed a gain 80% of the time, versus buy/hold/rebalance at 75%. The switching strategy had a higher average gain, median gain, and maximum gain.
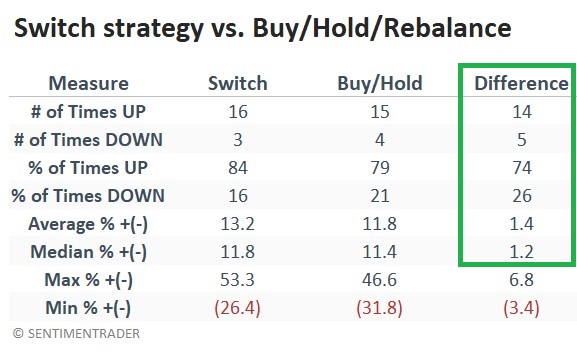
The table below shows individual year returns for the different strategies.
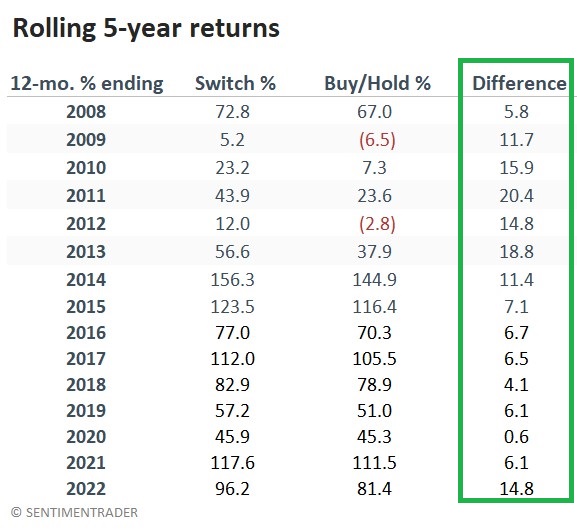
A look at rolling five-year returns
One strategy can outperform another strategy over the long term based solely on one or two periods of outperformance. So, let's take a closer look at switch versus buy/hold/rebalance to assess the consistency of outperformance.
We will look at rolling 5-year returns for each strategy for this test. At the end of May each year beginning in 2008, we will measure the return for each strategy over the previous five years. We will then subtract the 5-year performance for buy/hold/rebalance from the 5-year performance for the switching strategy to see how often the switching strategy outperforms and to what degree.
The switching strategy has outperformed buy/hold/rebalance over all 15 rolling 5-year periods. The average outperformance is +10.1%, and the median outperformance is +7.1%.
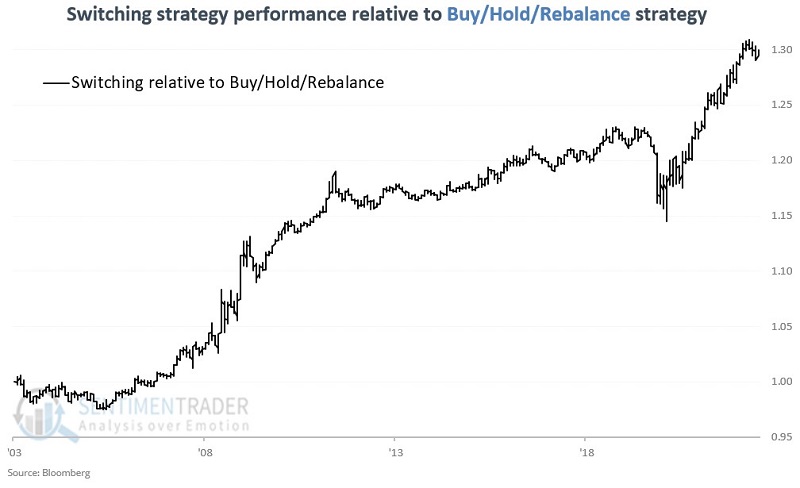
The line in the chart below shows a running comparison of the performance for the switching strategy relative to the buy/hold/rebalance strategy. The reality is that the line in the chart below is not a straight line advance. Nevertheless, the long-term trend favoring the switching strategy is pretty unmistakable.
A note on real-world trading
Remember that this strategy is not presented as some world-beater investment approach. Its sole objective is to offer a slight edge beyond simply buying and holding an index fund.
Another issue is taxes. If you buy and hold a single index fund or ETF in perpetuity, you never pay until you sell your shares (excluding taxable distributions or dividends). Presumably, you will pay long-term capital gains rates when that time comes. Conversely, if you make two trades a year, as the switching strategy does, you will generate two taxable events each year, with short-term tax rates applying. As a result, the switching strategy above is likely best followed in a non-taxable account.
What the research tells us…
Since RSP started trading, there has been a tendency for the unweighted S&P 500 Index to outperform during November through May. The reality is that there is no guarantee that this consistency will continue into the future. But the consistency of returns so far appears to make the above switching strategy a viable alternative for investors who have decided to invest in index funds.