
A significant surge in new highs

Key points:
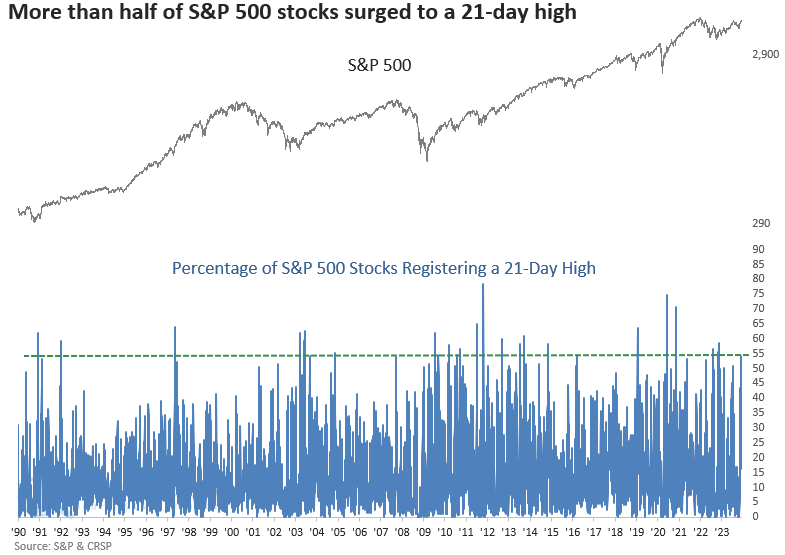
- The percentage of S&P 500 stocks registering a 21-day high surged above 54%
- Similar expansions in new highs led to additional upside momentum for stocks
- Value/cyclical-oriented groups like Financials, Industrials, and Materials drove the expansion
Increased participation is a positive development for the market
Just when we thought the S&P 500's fourth-best month in over a decade was reason enough to cheer, the world's most benchmarked index kicked off December by notching the highest expansion in 21-day highs since the fall of 2022.
When the percentage of S&P 500 stocks registering a 21-day high exceeds 54%, like now, it's a good indication of a bullish trend backdrop, which is why this breadth indicator is a component in my TCTM Composite Thrust Model.
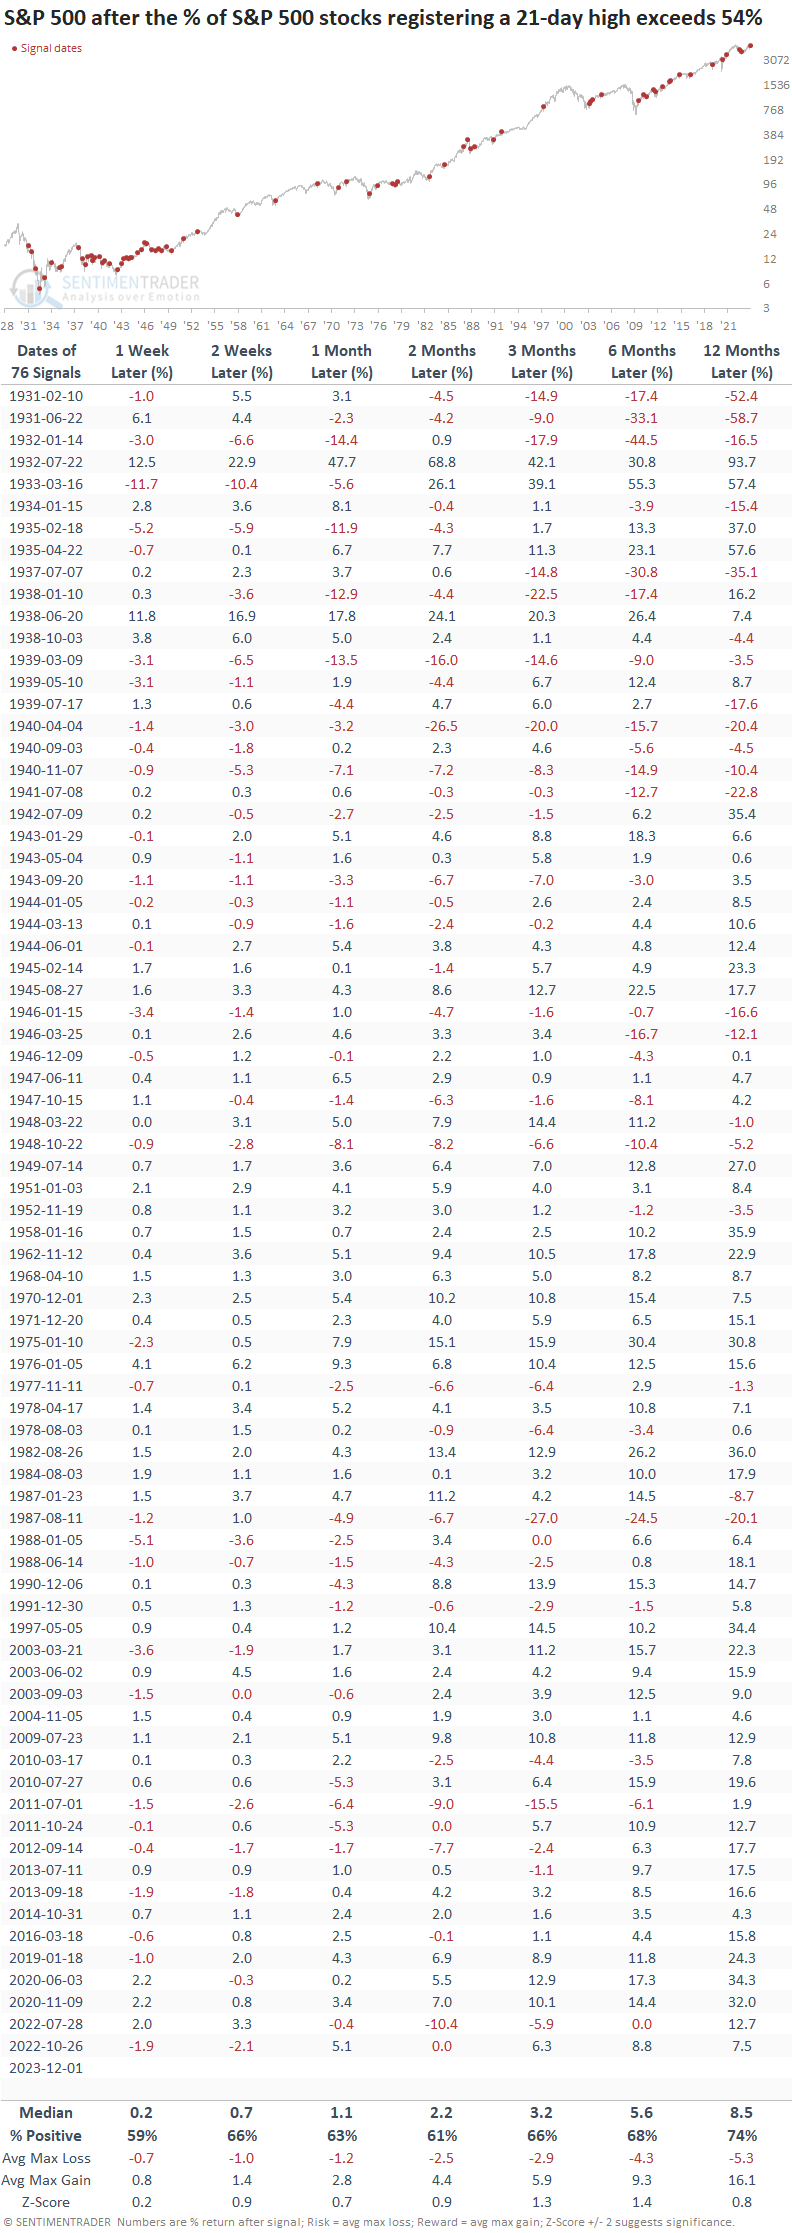
The previous signal triggered an alert in October 2022, leading to an 8.8% gain in the S&P 500 over the subsequent six months.
Similar surges in 21-day highs preceded positive returns
When the percentage of S&P 500 stocks hitting a 21-day high exceeds 54%, the expansion in new highs indicates a bullish trend profile.
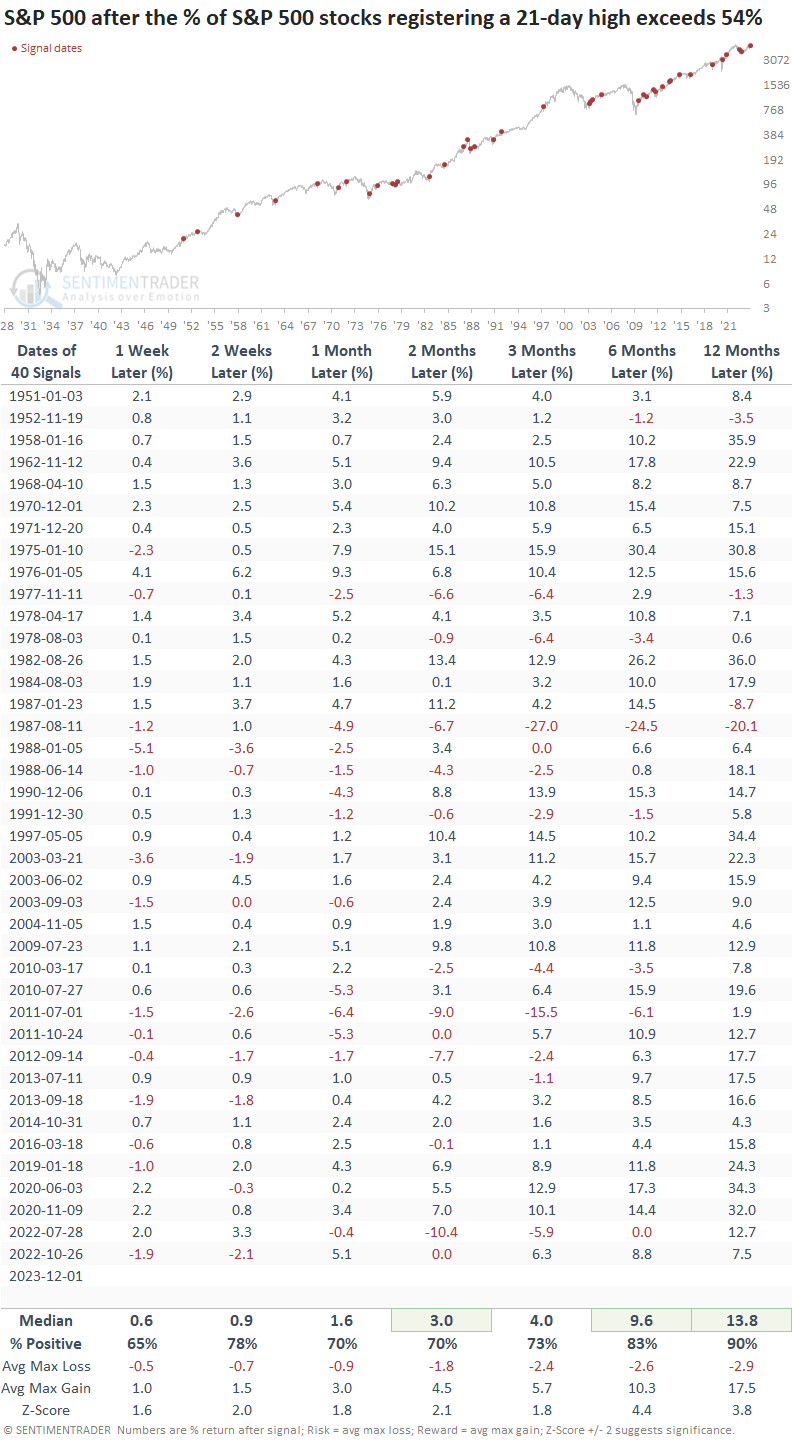
While performance metrics have consistently surpassed study period results since 1931, the overall outlook was adversely affected by the secular bear market of 1929-49. Since 1950, the S&P 500 was higher 90% of the time a year later, with signals before the 1987 crash accounting for two out of the three total losses.
Signals post the 1929-49 secular bear market
Since the 1987 crash, this indicator has a perfect record a year later.
What sectors contributed the most to the increase in new highs?
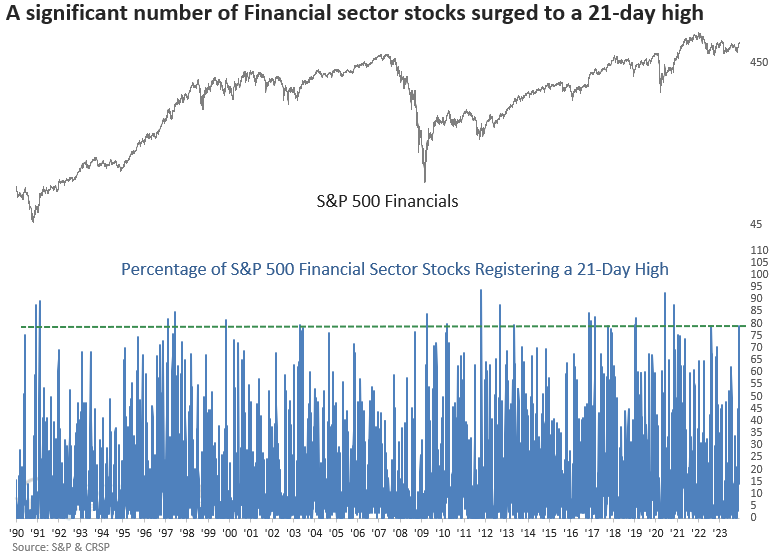
Value/cyclical-oriented groups fueled the expansion in the new high list. The significant increase in new highs from financial sector stocks is noteworthy, especially given the systemic importance of this group, which tends to underperform before recessions and bear markets.
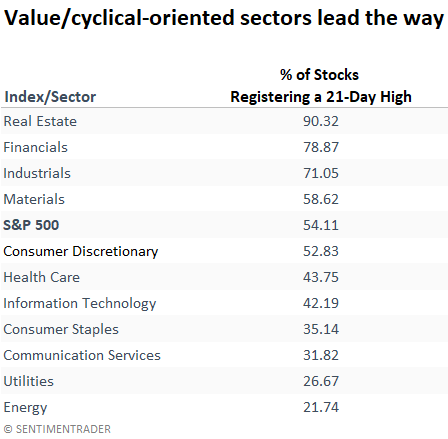
The percentage of S&P 500 Financial sector stocks registering a 21-day high exceeded 78% for only the 14th time since March 2009.
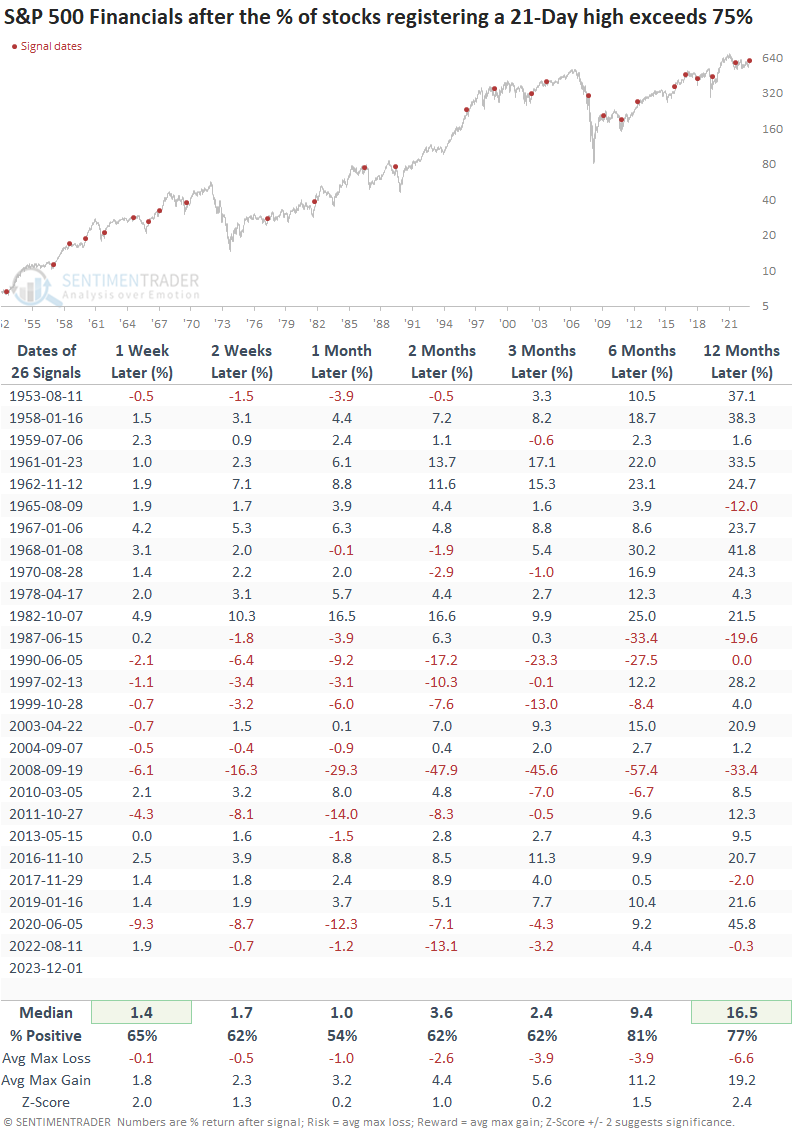
When more than 75% of S&P 500 Financial sector stocks hit a 21-day high, the group showed a reasonable consistent upward bias over time. However, since 1987, results have been less favorable.
The implications for the broad market
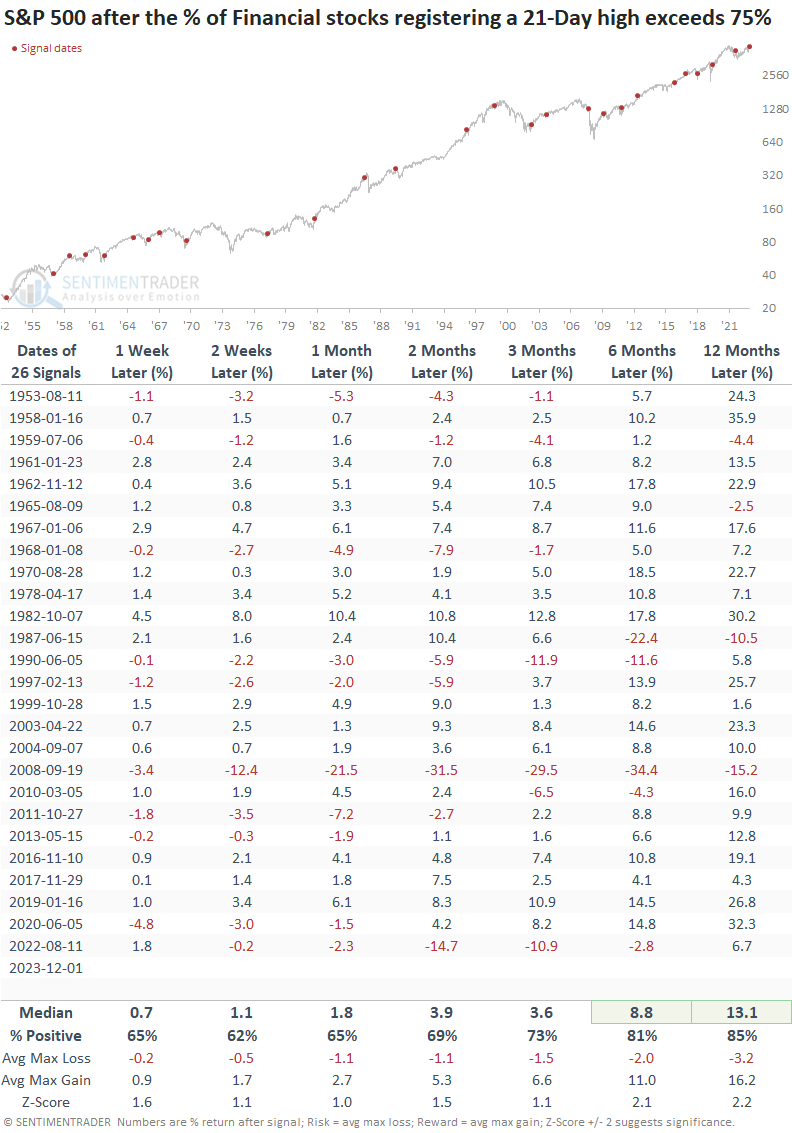
Results for the S&P 500 are solid when 21-day highs in the financial sector expand, like now, especially over the subsequent six and twelve-month horizons.
Value/cyclical-oriented industries
The significant number of breakouts in Financial, Industrial, and Material sector stocks was accompanied by almost every cyclical sub-industry group closing at a 21-day high.
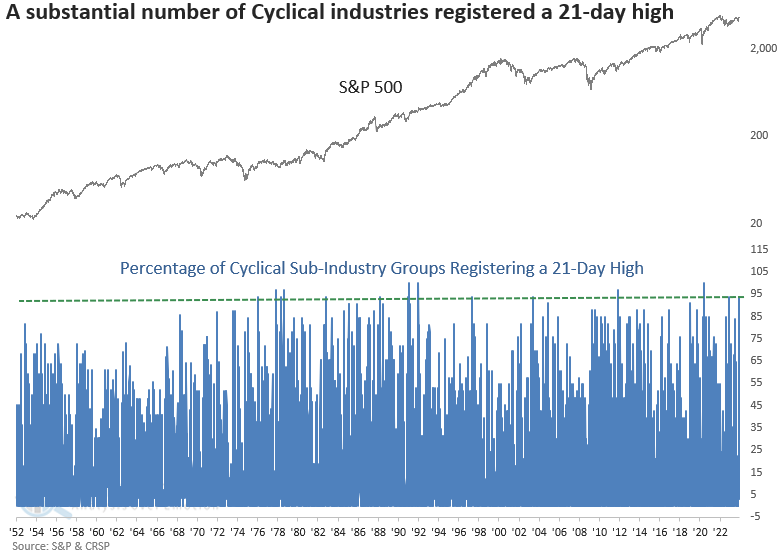
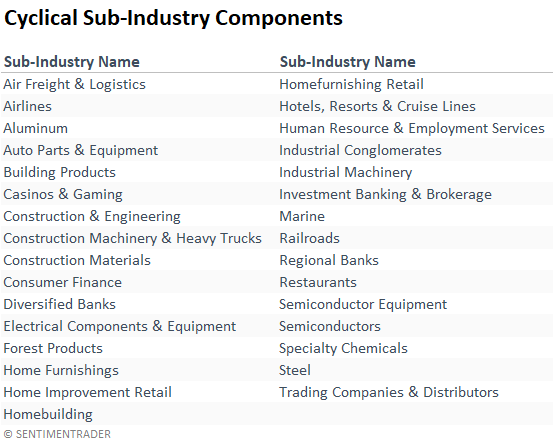
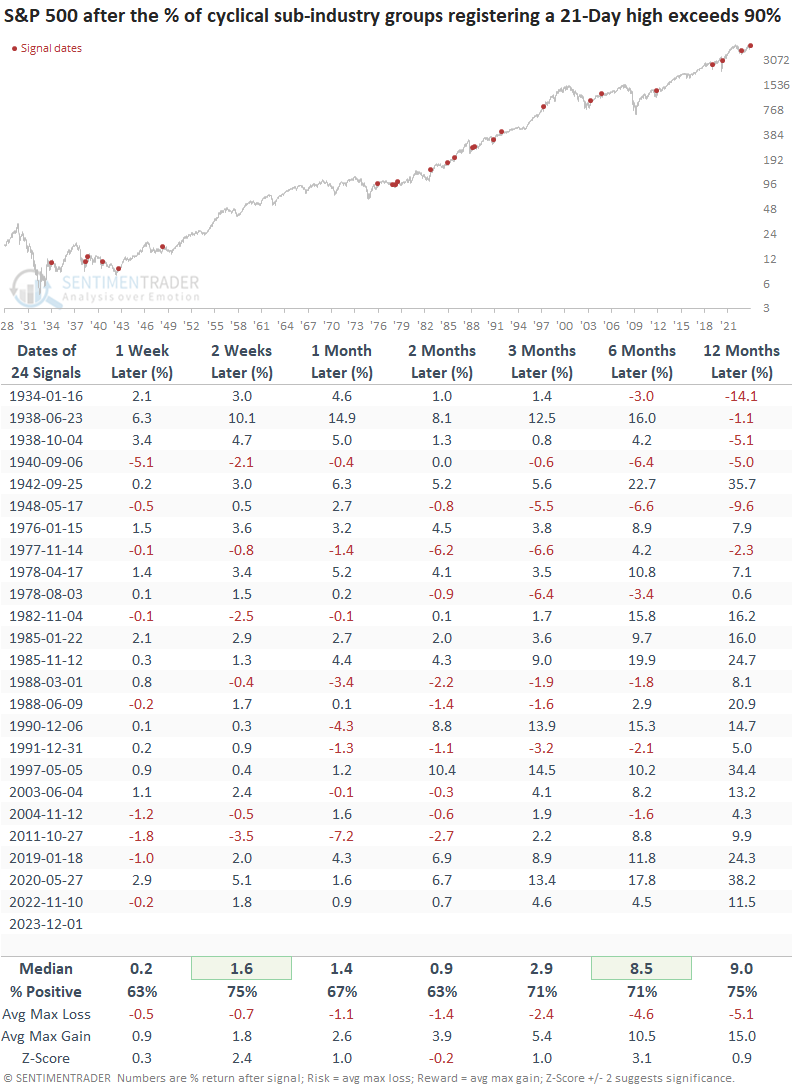
When more than 90% of cyclical sub-industry groups closed at a 21-day high, the S&P 500 was positive at some point over the following year in 23 out of 24 precedents.
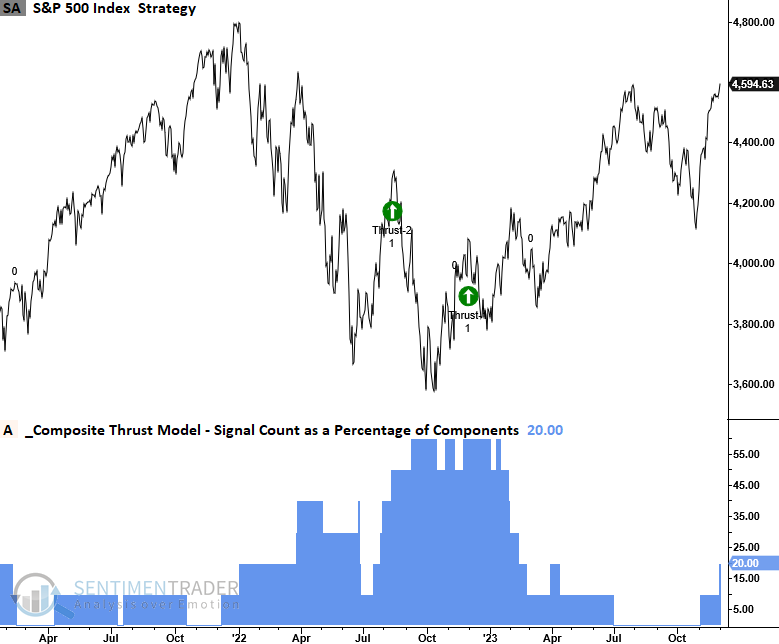
Tactical Composite Trend Model (TCTM)
The TCTM Composite Thrust Model signal count increased to 20% with the surge in 21-day highs.
What the research tells us...
Market breadth indicators are improving, suggesting a broadening of the stock rally with bullish implications. When a significant percentage of S&P 500 stocks register a 21-day high, like now, the world's most benchmarked index tends to rise consistently over the following year. That was especially the case since 1950. As always, nothing goes up in a straight line.