
A significant surge in Industrials bodes well for the group

Key points:
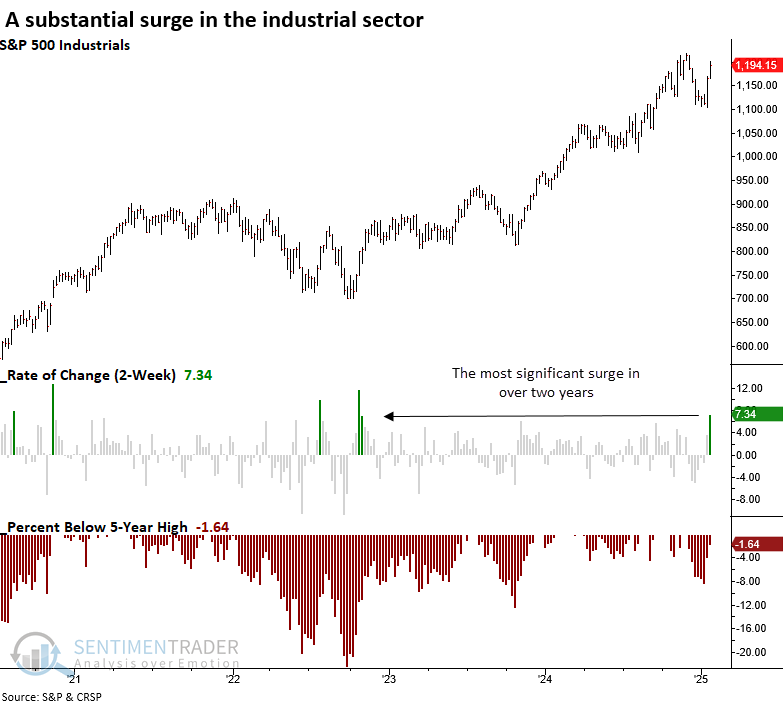
- Over the past two weeks, the S&P 500 industrials sector recorded its most substantial gain in two years
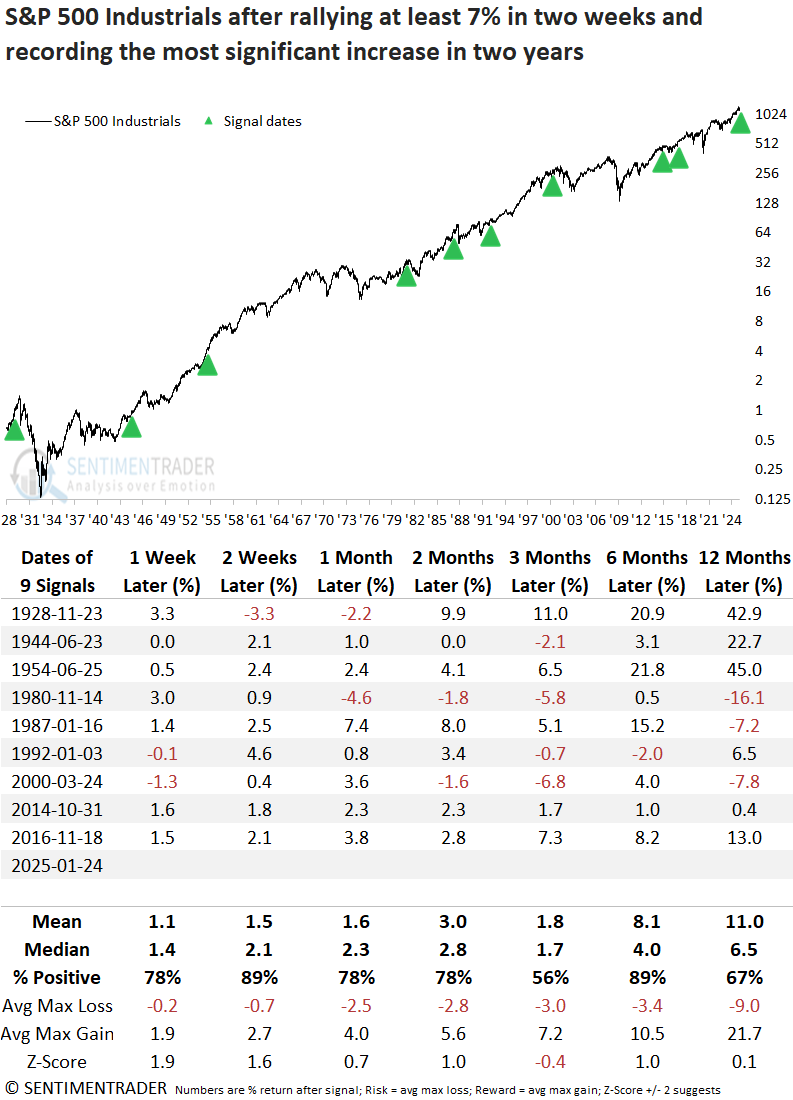
- Comparable surges saw the large-cap industrials group rise 89% of the time over the subsequent six months
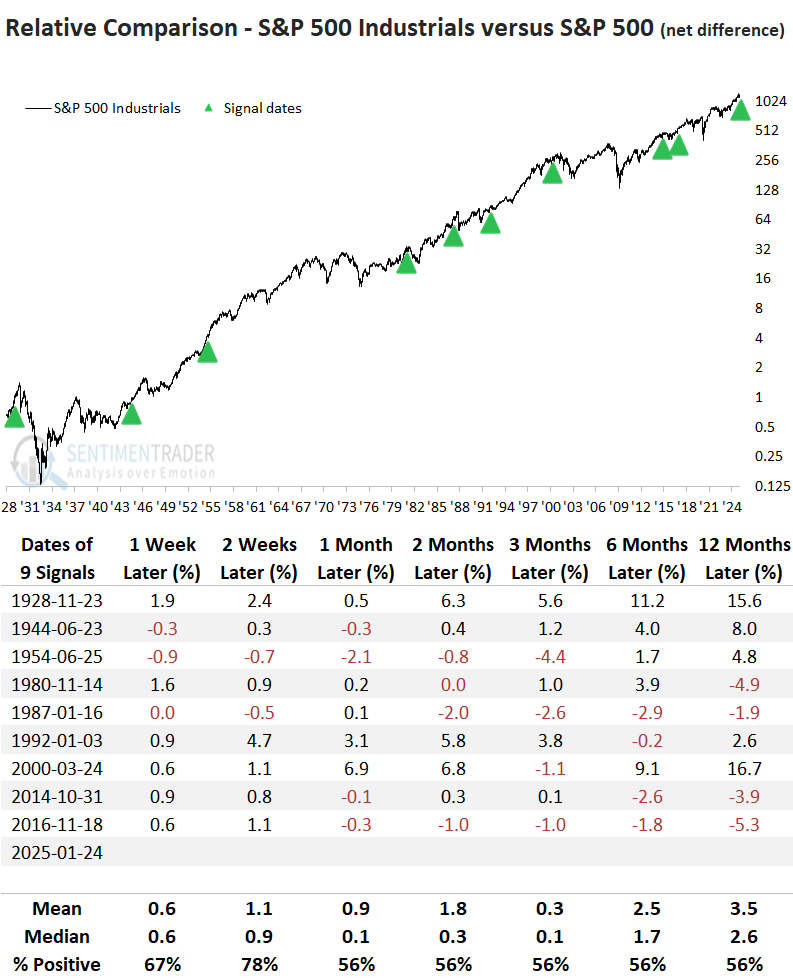
- Relative to the broader market, the group demonstrated a slight tendency to outperform the S&P 500
Another real-economy sector exhibited significant upside price momentum
Days like today underscore the critical importance of portfolio diversification. For this reason, I said the following in recent reports highlighting favorable price and breadth trends for the financials sector.
"From a big-picture perspective, the technical backdrop for the group looks solid. Investors would be wise to maintain a healthy allocation to this value-based group to offset the dominant factor, growth."
Over the past two weeks, the S&P 500 Industrials sector jumped more than 7%, marking its most significant two-week gain in two years, a feat last achieved in 2016 when including context such as trading above its 40-week moving average and residing within 5% of a 5-year high.
Interestingly, the 2016 event coincided with the immediate aftermath of Trump's first election.
Comparable surges in the industrial sector suggest the rally persists
Although rare, whenever the S&P 500 Industrials jumped by at least 7% in two weeks and recorded the most substantial gain in two years while exhibiting trend characteristics similar to today, the cyclical sector tended to rally, rising 89% of the time over the following six months.
Two precedents coincided with significant market tops for the broad market, November 1980 and March 2000, each defined by heightened concentration.
Industrials consistently displayed relative strength versus the S&P 500, although it was not meaningful. Furthermore, in the 1980 and 2000 scenarios, the sector outpaced the world's most benchmarked index in the favorable six-month horizon.
Relative trend outlook
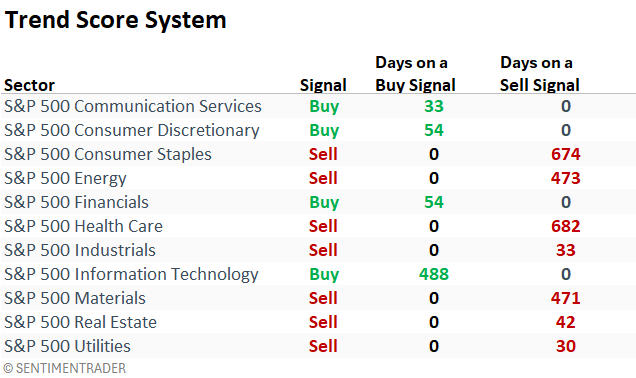
According to the relative strength timing systems on the website's strategy page, industrials lost their favorable outlook against the broader market in December 2024, resulting in a sell signal.
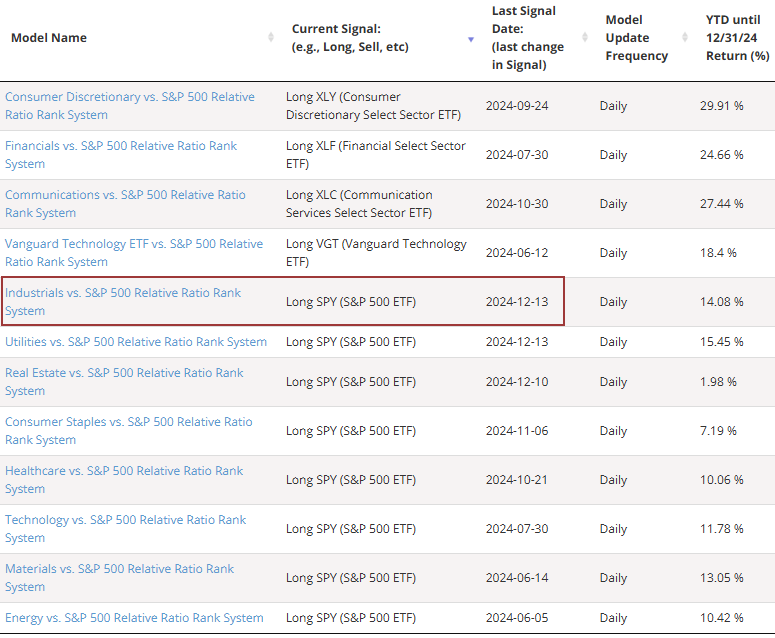
A system leveraging the newly introduced trend and relative trend score composites on the website triggered a sell signal for the sector in early December as the relative trend composite dropped to a score of three.
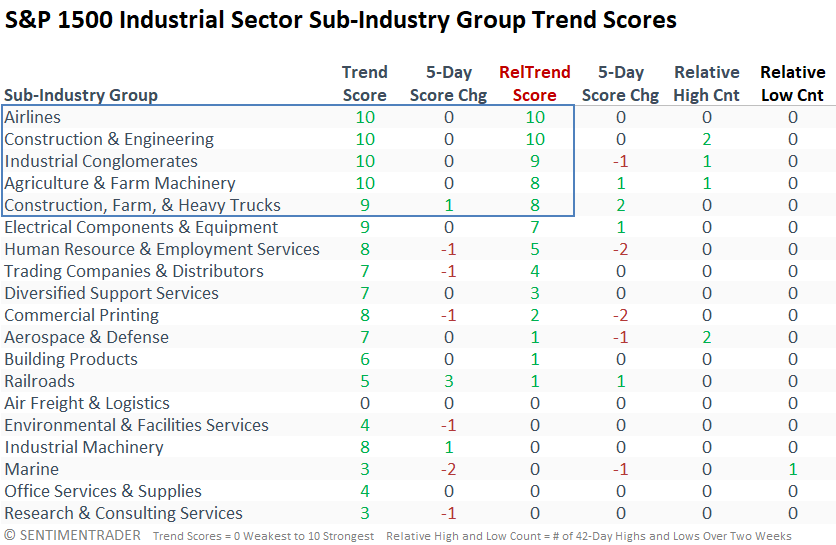
Without a clear tailwind for industrials, assessing sub-industry groups and specific stocks in the sector would be prudent.
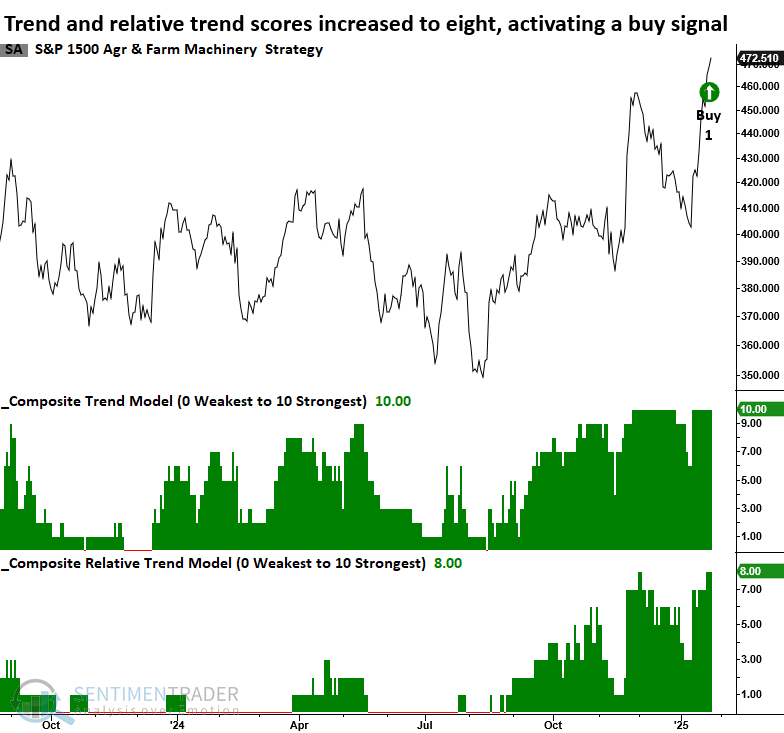
Several industries within the sector maintain favorable trend and relative trend scores, including Agriculture and Farm Machinery, which triggered a buy signal on 2025-01-24 when both scores exceeded eight or higher simultaneously.
Stocks within the Agriculture and Farm Machinery group include Deere, Agco, CNH Industrial, and Art's Way Manufacturing.
What the research tells us...
Over the past two weeks, the S&P 500 Industrials sector has posted its largest rally in two years. While this level of price momentum in an uptrend is rare, it has historically signaled sustained strength, with Industrials often outperforming the broader market over the next six months. With Technology possibly sidelined for now, attention may shift to Industrials. Subgroups such as Agricultural and Farm Machinery, which recently broke out of a multi-year range and triggered a trend score buy signal, present an intriguing alternative for investors seeking opportunities beyond growth stocks.