
A significant reversal in commodity momentum

Key points:
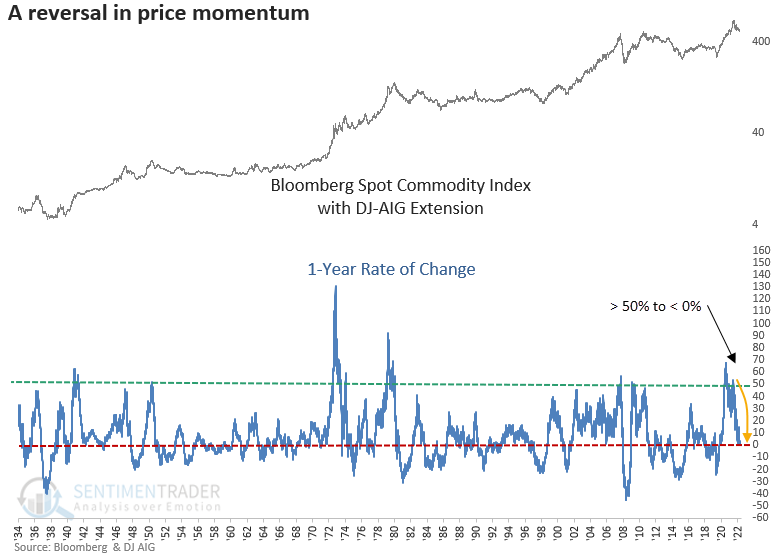
- The 1-year rate of change for a spot commodity index cycled from > 50% to < 0%
- After similar reversals, a broad basket of commodities struggled over the next six to twelve months
- Long-term uptrends for individual commodities also suggest a cautionary tone
A significant reversal in commodity momentum
For only the eighth time in almost 80 years, the 1-year rate of change for a spot commodity index cycled from > 50% to < 0%.
While commodities are highly susceptible to mean reversion, the shift in commodity momentum is interesting, given the nearly 11% decline in Dollar Index (DXY) over the last four months. Remember, commodities tend to exhibit bullish price action when the dollar weakens.
Using history as a guide, let's see if we can find a market message from the most significant reversal in commodity momentum in four decades.
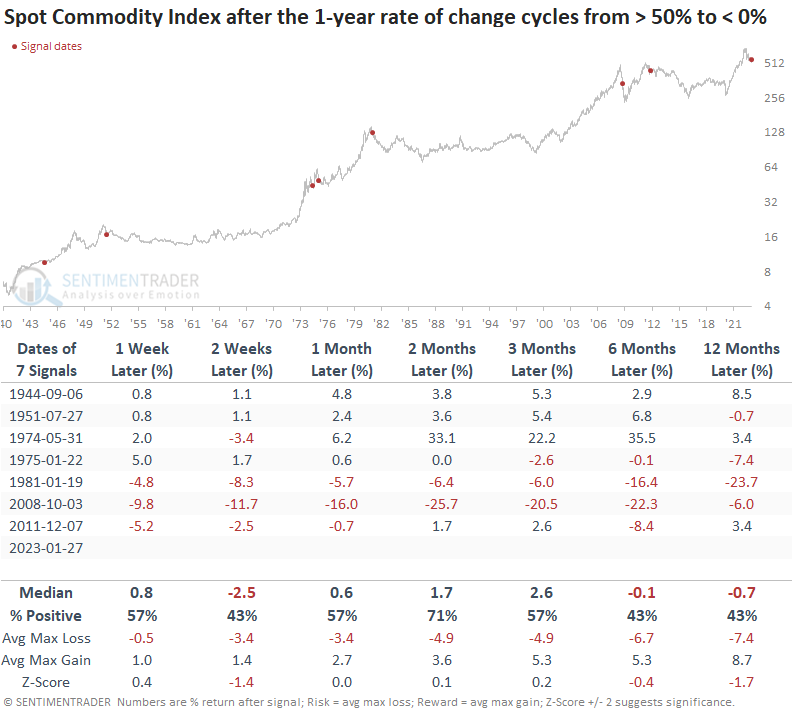
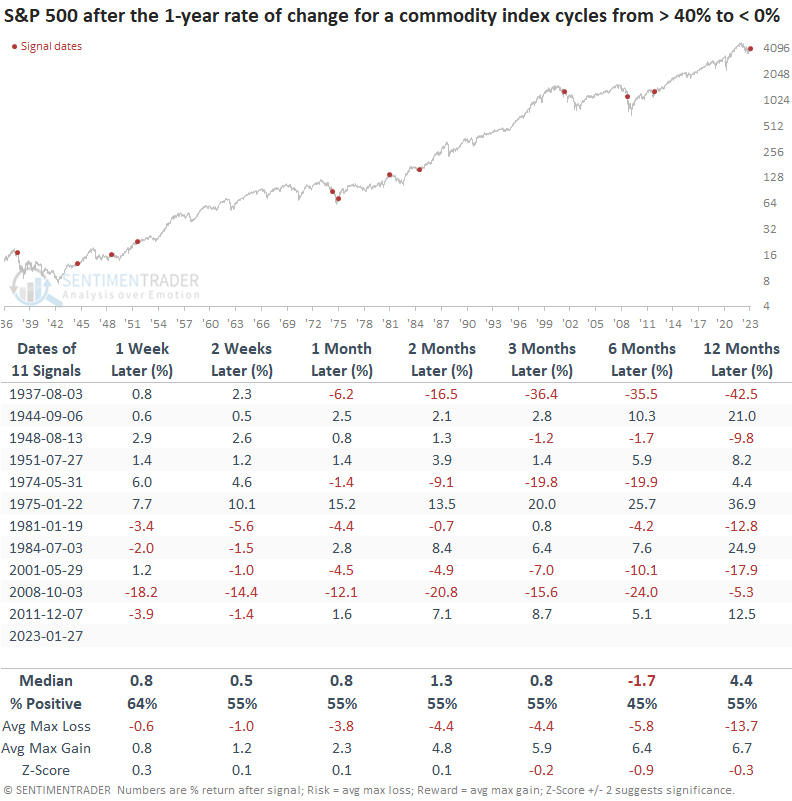
When the 1-year rate of change for a commodity index cycles from > 50% to < 0%, commodities struggle, especially six to twelve months later.
While the sample size is small, recent signals tended to show a more negative outlook.
As with stocks, individual commodities can take on a life of their own as fundamental drivers like supply and demand dictate price action.
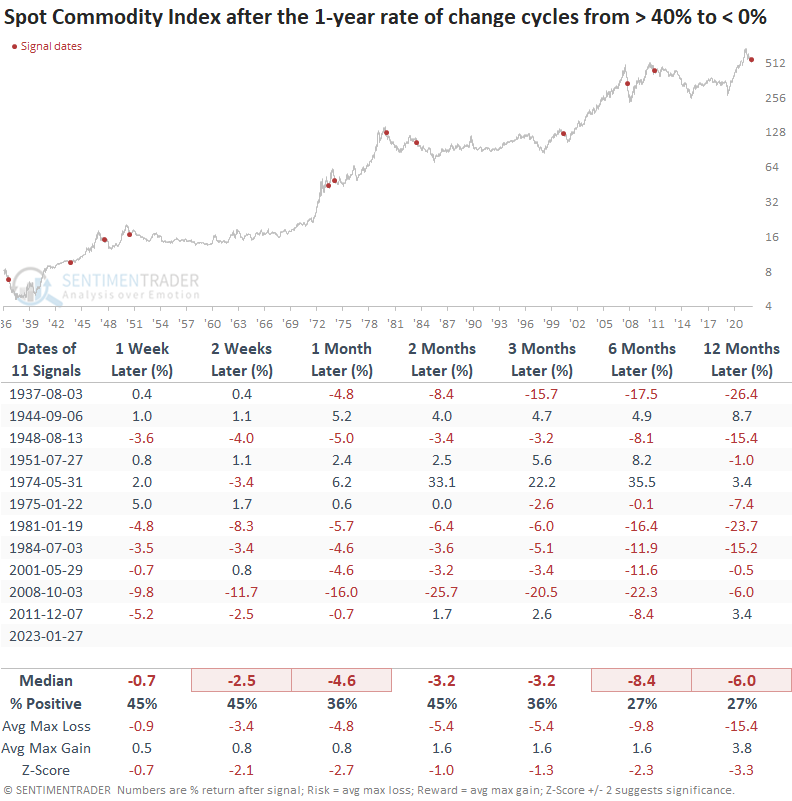
Let's lower the rate of change threshold from 50% to 40% to increase the sample size. In that case, the reversal in price momentum from > 40% to < 0% looks even more unfavorable for a spot commodity index. Median returns were negative across all time frames. The 2001 signal is a fascinating analog if you think commodities are in a secular uptrend.
Stocks response to an easing in commodity prices
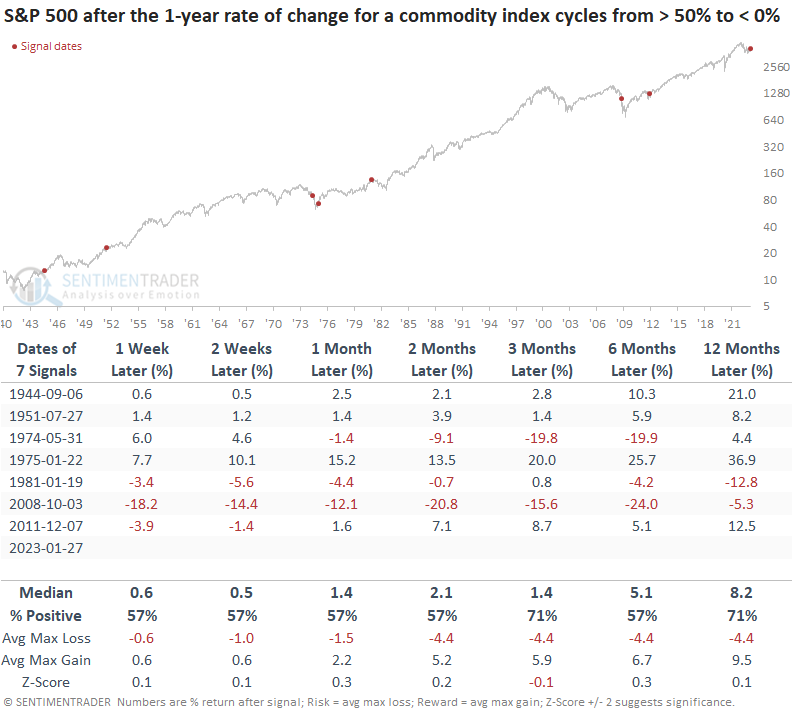
Interestingly, the response from stocks is not as bullish as expected, given an easing in commodity prices. So, it might make more sense to be mindful of the economic message from commodities rather than the inflation message.
As with commodities, when I lower the upper threshold level from 50% to 40% to increase the sample size, the outlook for stocks deteriorates, especially six months later. Most signals occurred during growth-scare corrections or bear markets accompanied by a recession.
The trend is not your friend
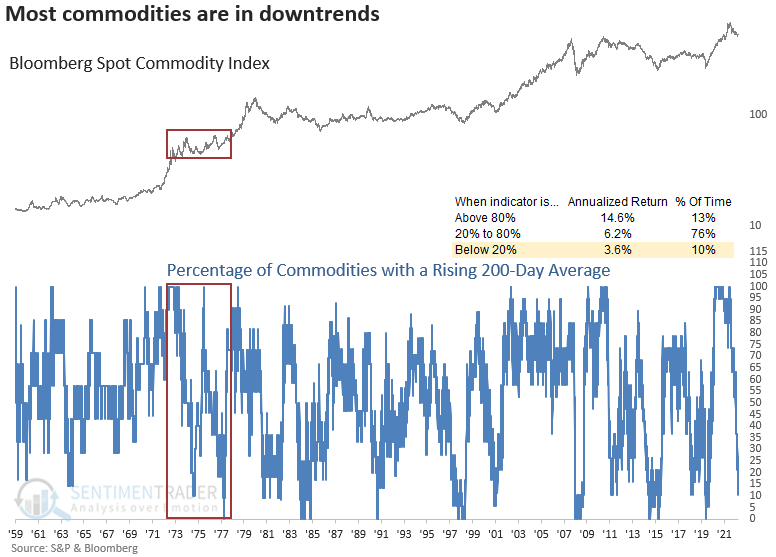
With price momentum reversing lower, it's not surprising to see so few commodities with a rising 200-day average. Historically, when 20% or fewer commodities maintain a long-term uptrend, annualized returns for a commodity index look less compelling.
Suppose commodities are in a secular uptrend, and the current drawdown is a cyclical bear with a secular bull. In that case, the mid to late 1970s might be an excellent analog to study. The percentage of commodities with a rising 200-day average declined to a level similar to now on two occasions.
What the research tells us...
Coming out of the Covid recession/bear market, commodities exhibited some of the best long-term price momentum trends since the 1970s. However, that bullish momentum is now unraveling, with the 1-year rate of change for a commodity index cycling from > 50% to < 0%. After similar reversals, commodities struggled, and stocks were somewhat uninspiring. With negative price momentum at the index level and very few commodities in a long-term uptrend, I would avoid a broad-based allocation to a commodity index/ETF for now. From a big-picture perspective, one has to wonder what, if any, message we should take away from the negative momentum in commodities.