
A significant reversal for two bellwether semiconductor stocks

Key points:
- Nvidia and Advanced Micro Devices experienced substantial downside reversals from all-time highs
- Similar price patterns suggest a potential consolidation for Nvidia and a cautious outlook for AMD
- A capitalization-weighted semiconductor index is off to the 4th best start to a year since 1960
"There are no new eras - excesses are never permanent" - Bob Farrell
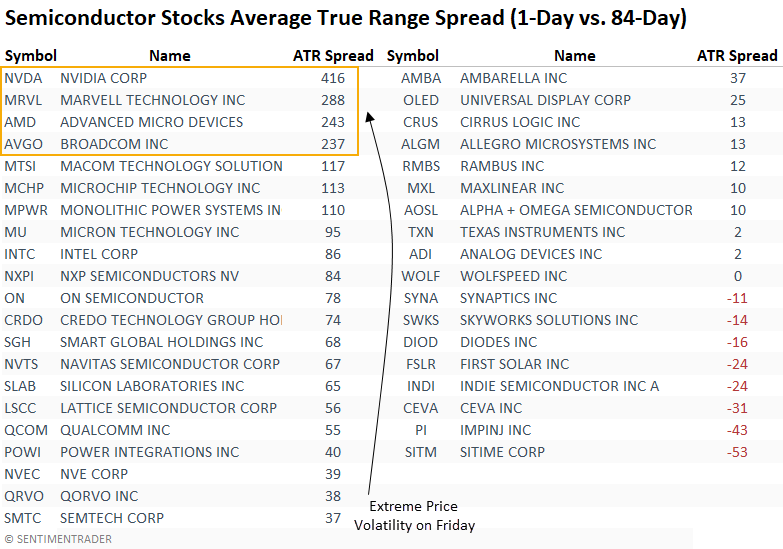
Friday marked an interesting turn of events for Nvidia and Advanced Micro Devices, the two semiconductor giants driving the artificial intelligence frenzy. Following an initial surge of 5% and 7.5% to all-time highs, the stocks reversed course, ultimately closing with losses of -5.5% and -1.9%, creating a massive daily trading range.
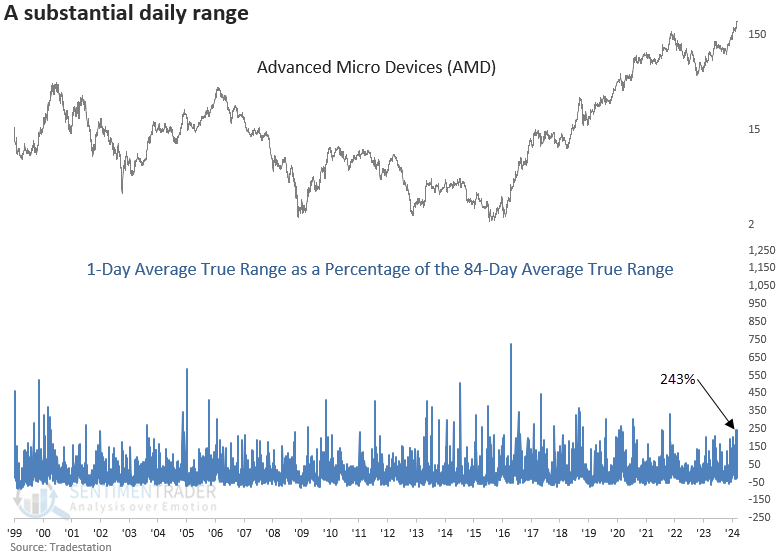
For measuring ranges, I prefer J. Welles Wilder's Average True Range. This calculation utilizes the previous day's closing price when a stock experiences a gap beyond the prior day's range, creating a more realistic representation of price volatility as measured by this adjusted intraday high-to-low range.
As the table below shows, Nvidia and Advanced Micro Devices' 1-day Average True Range as a percentage of their respective 84-day Average True Range spiked to 416% and 243%, signifying extreme intraday price volatility.
Let's identify historical precedents that closely resemble last Friday's market movements to assess whether the price action signified a one-off event within an uptrend or something more meaningful.
I will use the following criteria:
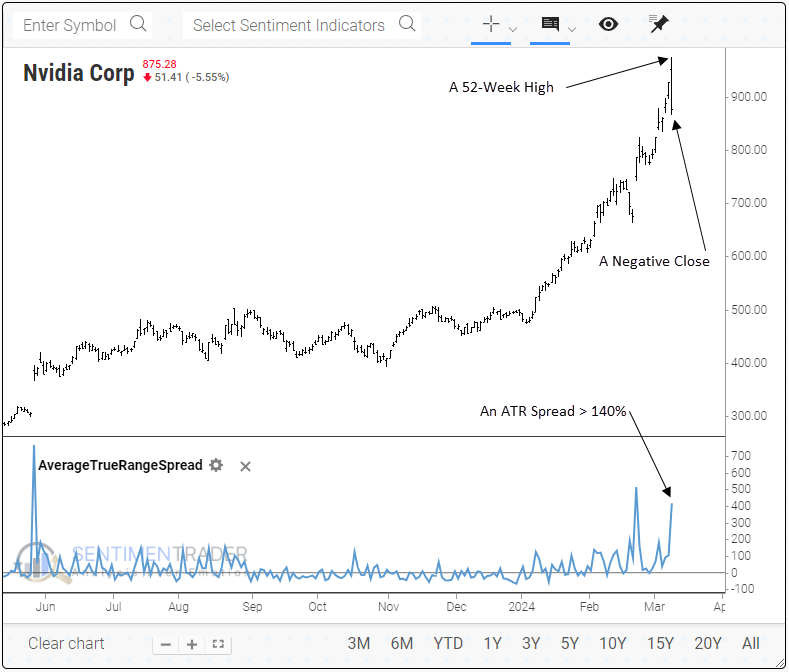
- A 52-week high
- An ATR spread greater than 140% (I had to lower the threshold to increase the sample size)
- A negative close
The following chart contains annotations with the price behavior criteria, providing a clearer understanding of the study conditions.
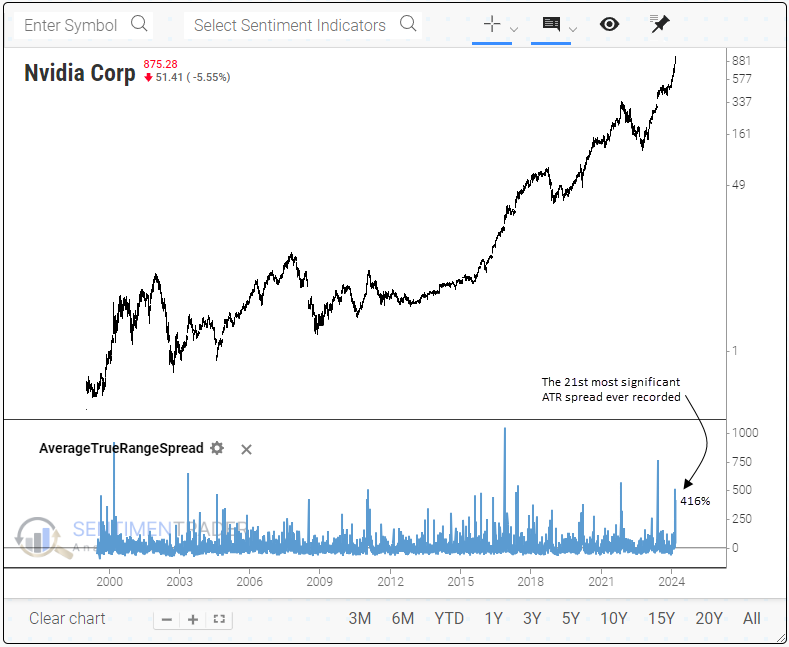
By zooming out, we can gain a broader perspective on the significance of Nvidia's Average True Range spread compared to history. Friday's daily range as a percentage of the 84-day average ranked as the 21st most signficant spread in history.
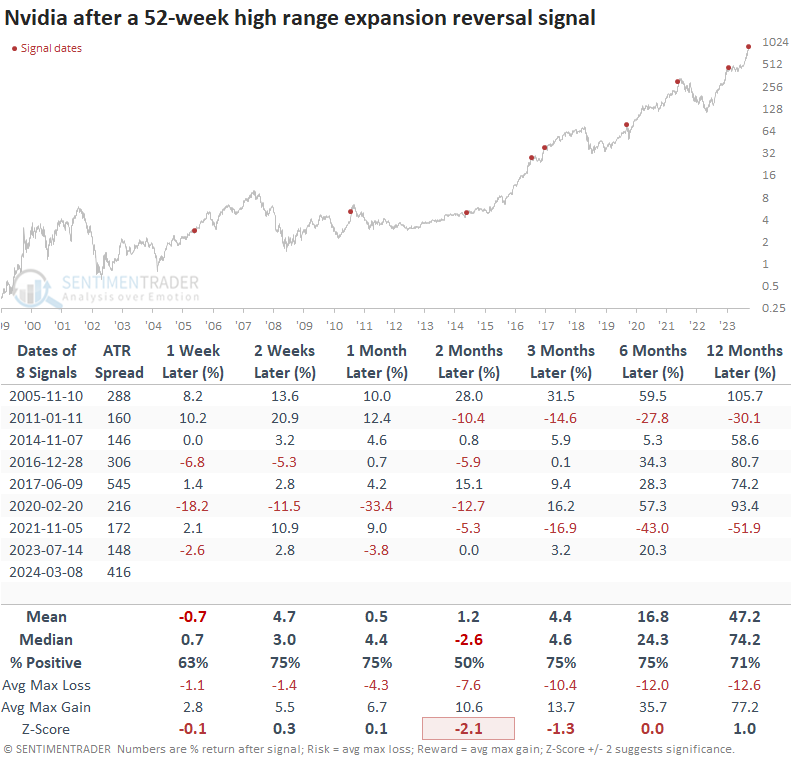
Similar range expansion reversals suggest a potential consolidation
While the sample size is small, similar reversal patterns suggest Nvidia could rally further in the near term before taking a hiatus from the extraordinary upside momentum over the next few months. Should a pause develop, traders could benefit by buying the dip as the following six months provide a solid outlook.
If we look at the most recent signal, July 2023, which occurred in the new AI era, Nvidia consolidated for four months and registered a -10% max loss before the uptrend resumed.
While not as pronounced as Nvidia, AMD's Average True Range spread increased to one of the highest levels in more than two years.
Following reversals from a 52-week high similar to the one experienced on Friday, the outlook for AMD was pretty bleak, with several instances representing signficant tops. Over the following three months, the stock was lower at some point in 12 out of 16 cases.

When I applied the range expansion reversal criteria to Marvell (MRVL) and Broadcom (AVGO), neither stock produced more than two signals. I also looked at Intel (INTC) and Cisco (CSCO), two Dotcom-era bellwethers, and found only a few signals in the 1990s. Neither occurred within shouting distance of the March 2000 peak.
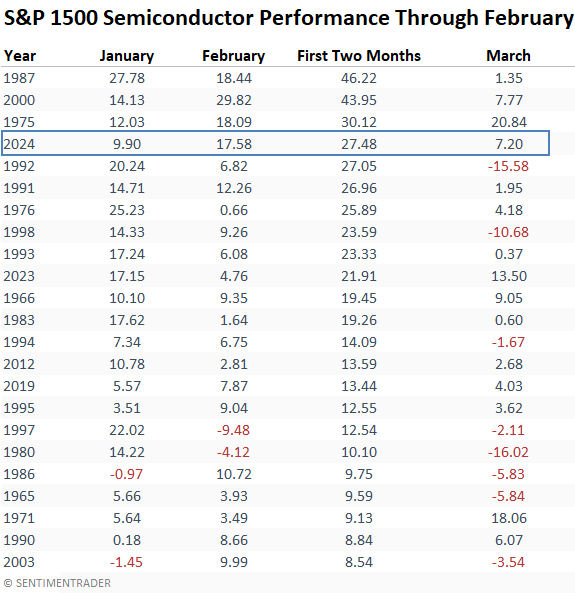
A fast start to the year
Through the end of February, the S&P 1500 semiconductor sub-industry group is off to the 4th best start to a year since 1960. Despite Friday's setback, March has kicked off with a robust start, up 7.2%.
In 1987, semiconductors remained on an upward trajectory before suffering a setback in May; similarly, in 2000, they sustained gains until April before encountering a loss. The momentum continued in 1975 until July. However, we must remember that this precedent followed the 1973-74 bear market when stocks were still significantly below previous highs.
What the research tells us...
Last Friday, both Nvidia and Advanced Micro Devices (AMD) experienced significant downside reversal patterns, potentially firing a shot across the bow of a red-hot group. Investors should keep a close on the stocks and the broader group even though absolute and relative trends remain solid. For Nvidia, history indicates that such reversals could lead to a temporary pause within an uptrend. On the other hand, Advanced Micro Devices' price pattern implies a potentially bleaker outlook, as the company may face challenges beyond short-term fluctuations.