Products
SentimenTrader Trading Tools
‍
Backtest Engine
My Trading Toolkit
Correlation Analysis
Seasonality
Market Prediction
Indicators & Data API
‍
Proprietary Indicators & Charts
Market Data API
Strategies & Scanner
‍
50+ Trading Strategies
Smart Stock Scanner
Smart Option Scanner
Research Reports
‍
Research Solutions
Reports Library
Free Resources
Simple Backtest Calculator
Simple Seasonality Calculator
The Kelly Criterion Calculator
Sentiment Geo Map
Public Research Reports
Education
Sentiment Indicators
Technical Indicators
Pricing
Company
About
In the News
Testimonials
Client Success Stories
Contact
Log inLoginSign up
< BACK TO ALL REPORTS

A significant number of new highs bodes well for the market

Dean Christians
2024-12-06
For only the eighth time in history, the S&P 500 has reached 56 highs within a rolling one-year period. In every previous instance, similar price action led to a gain in the S&P 500 over the following six months.

Key points:

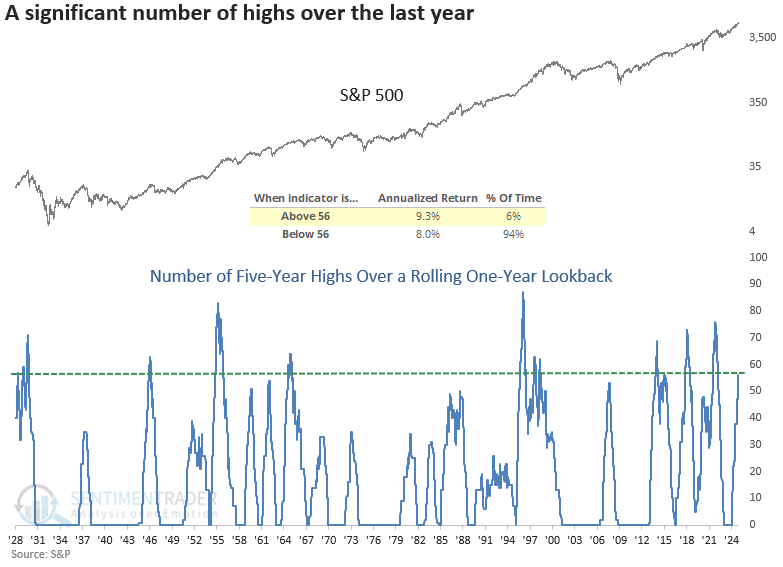
  • The S&P 500 has recorded 56 highs over a rolling one-year lookback 
  • Comparable surges in new highs produced a 100% win rate for the S&P 500 over the subsequent six months
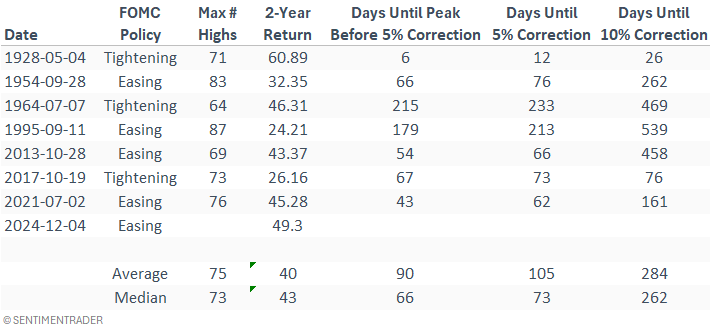
  • It took the S&P 500 a median of 66 days to peak and then experience a 5% correction

Persistent highs are a strong affirmation of a bull market in action

There's been a lot of chatter about the number of record highs for the S&P 500 in 2024. Through Thursday, the total count reached 56 days. Rather than comparing record highs on a calendar year basis, I decided to assess this persistent march higher using a rolling one-year lookback of 5-year highs for a slightly different perspective.

Additionally, I applied two other conditions: the count had to reset to five or fewer days before a new signal could trigger, and the S&P 500 needed to have at least one record high. These requirements led to the inclusion of a precedent from 1954 (6 out of 56 were a record high) but excluded the 1946 case, as the S&P 500 did not achieve a record high when the count reached 56. In all other cases, the total count of 56 was a record high.

The chart below shows that the S&P 500 achieves an annualized return of 9.3% when the count exceeds 56, compared to an 8% return when the total resides below this threshold. This outlook challenges the notion held by some market participants that the current bull market is overextended, which invokes the following quote from Keynes: "The market can stay irrational longer than you can stay solvent." 

Positive momentum begets more positive momentum

Whenever the S&P 500 reached a 5-year high on 56 occasions within a one-year rolling period, the uptrend in the world's most benchmarked index was likely to persist, with the S&P 500 rallying 100% of the time over the following six months.

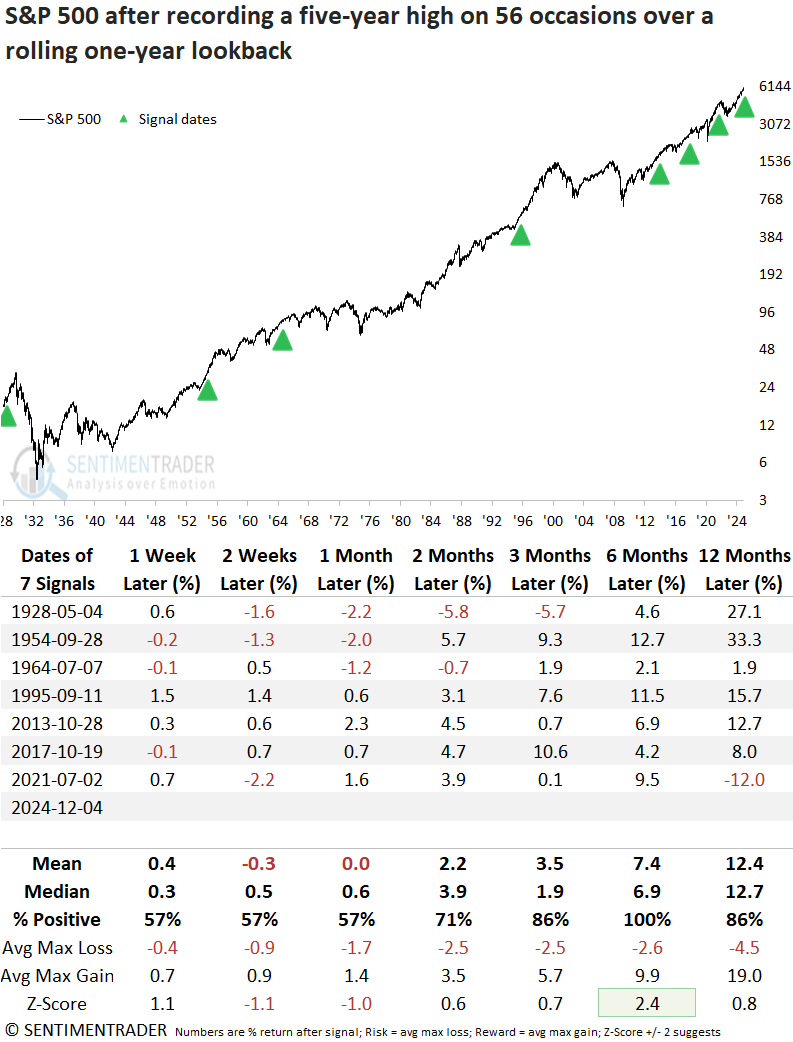
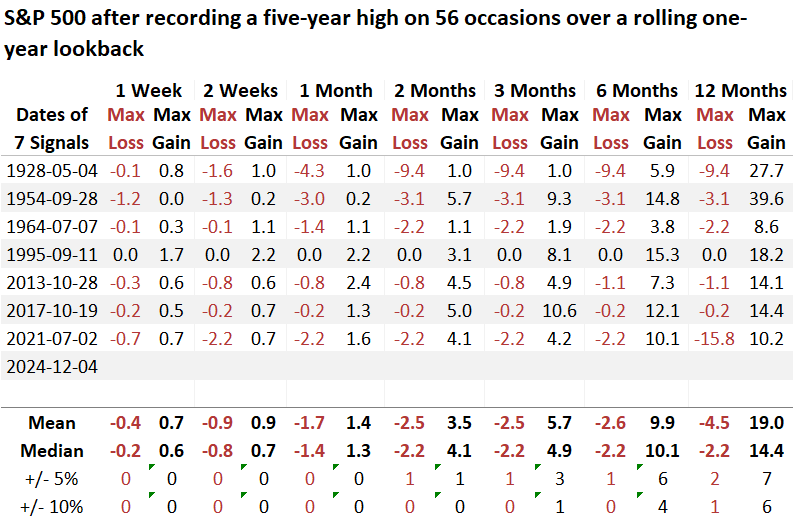
In the following six months, the S&P 500 incurred only one maximum loss of more than 5% and none that surpassed 10%, although 1928 was close. 

A historical comparison

Following comparable signals, the median number of days until the S&P 500 peaked and embarked on a 5% or greater correction stood at 66 trading sessions or roughly three months. I would also note that when the two-year rolling return for the S&P 500 exceeded 40%, which is the case now, returns at the three-month interval were generally flat or down in the case of 1928. 

As a result, a consolidation wouldn't be unexpected at some point in the first quarter of next year. 

What the research tells us...

The S&P 500 has achieved an impressive 56 highs over the past year, a feat surpassed only eight other times since 1928. While such relentless price momentum suggests that the market is overextended, history tells a different story. In fact, this level of momentum has typically signaled that the rally is far from over. Following similar precedents, the S&P 500 was higher on every occasion in the six months that followed, indicating that the market's strength was not a fleeting anomaly but a signal of continued upward momentum. However, markets seldom progress in a straight line, and as a result, these signals have seen a 5% pullback, typically around three months later, pointing to potential profit-taking in Q1 2025. 

PRODUCTS
SentimenTrader
Trading Tools
Indicators & Data API
‍
Strategies & Scanner
‍
Research Reports
FREE
RESOUrCES
Simple Backtest
Calculator
Simple Seasonality
Calculator
The Kelly Criterion
Calculator
Sentiment Geo Map
‍
Public Research Reports
‍
Education
Sentiment Indicators
‍
Technical Indicators
‍
Pricing
Bundle pricing
‍
FAQ
‍
Announcements
‍
COMPANY
‍
About
‍
In the News
‍
Testimonials
‍
Client Success Stories
CONTACT
‍
General Inquiries
‍
Media Inquiries
‍
Financial Professionals Inquiries
‍
© 2026 Sundial Capital Research Inc. All rights reserved.
Setsail Marketing
TermsPrivacyAffiliate Program
Risk Disclosure: The information and tools provided are for research and analytical purposes only and are not intended as investment advice. Market analysis involves uncertainty, and outcomes may differ from expectations. Users should conduct their own due diligence and consider their individual circumstances before making any financial decisions. Past performance is not necessarily indicative of future results.

Hypothetical Performance Disclosure: Hypothetical performance results have many inherent limitations, some of which are described below. No representation is being made that any account will or is likely to achieve profits or losses similar to those shown; in fact, there are frequently sharp differences between hypothetical performance results and the actual results subsequently achieved by any particular trading program. One of the limitations of hypothetical performance results is that they are generally prepared with the benefit of hindsight. In addition, hypothetical trading does not involve financial risk, and no hypothetical trading record can completely account for the impact of financial risk of actual trading. for example, the ability to withstand losses or to adhere to a particular trading program in spite of trading losses are material points which can also adversely affect actual trading results. There are numerous other factors related to the markets in general or to the implementation of any specific trading program which cannot be fully accounted for in the preparation of hypothetical performance results and all which can adversely affect trading results.

Testimonial Disclosure: Testimonials appearing on this website may not be representative of other clients or customers and is not a guarantee of future performance or success.