
A Significant Number of Communication Services Stocks Are Showing Renewed Strength

Key points:
- A short-term breadth thrust signal, indicating a rapid improvement in internal momentum, has recently triggered for the Communication Services (XLC) sector.
- Historically, similar signals have been followed by positive long-term returns for both XLC and the broader S&P 500, with XLC showing significant outperformance.
- The data also reveals a distinct pattern of initial weakness and a high probability of significant drawdown risk, presenting a complex historical precedent.
- An analysis of individual stocks within the sector using trend and relative strength scores can be utilized to identify current market leadership.
A breadth thrust in a key growth sector
Market breadth indicators are valuable tools for assessing the internal health of an index or sector. A "breadth thrust" occurs when there is a rapid expansion in the number of stocks participating in an uptrend, which can indicate a significant shift in underlying market dynamics. A short-term thrust, in particular, often marks an impulse or an inflection point, signaling a change in character from a period of indecision or weakness to one of broad-based strength.
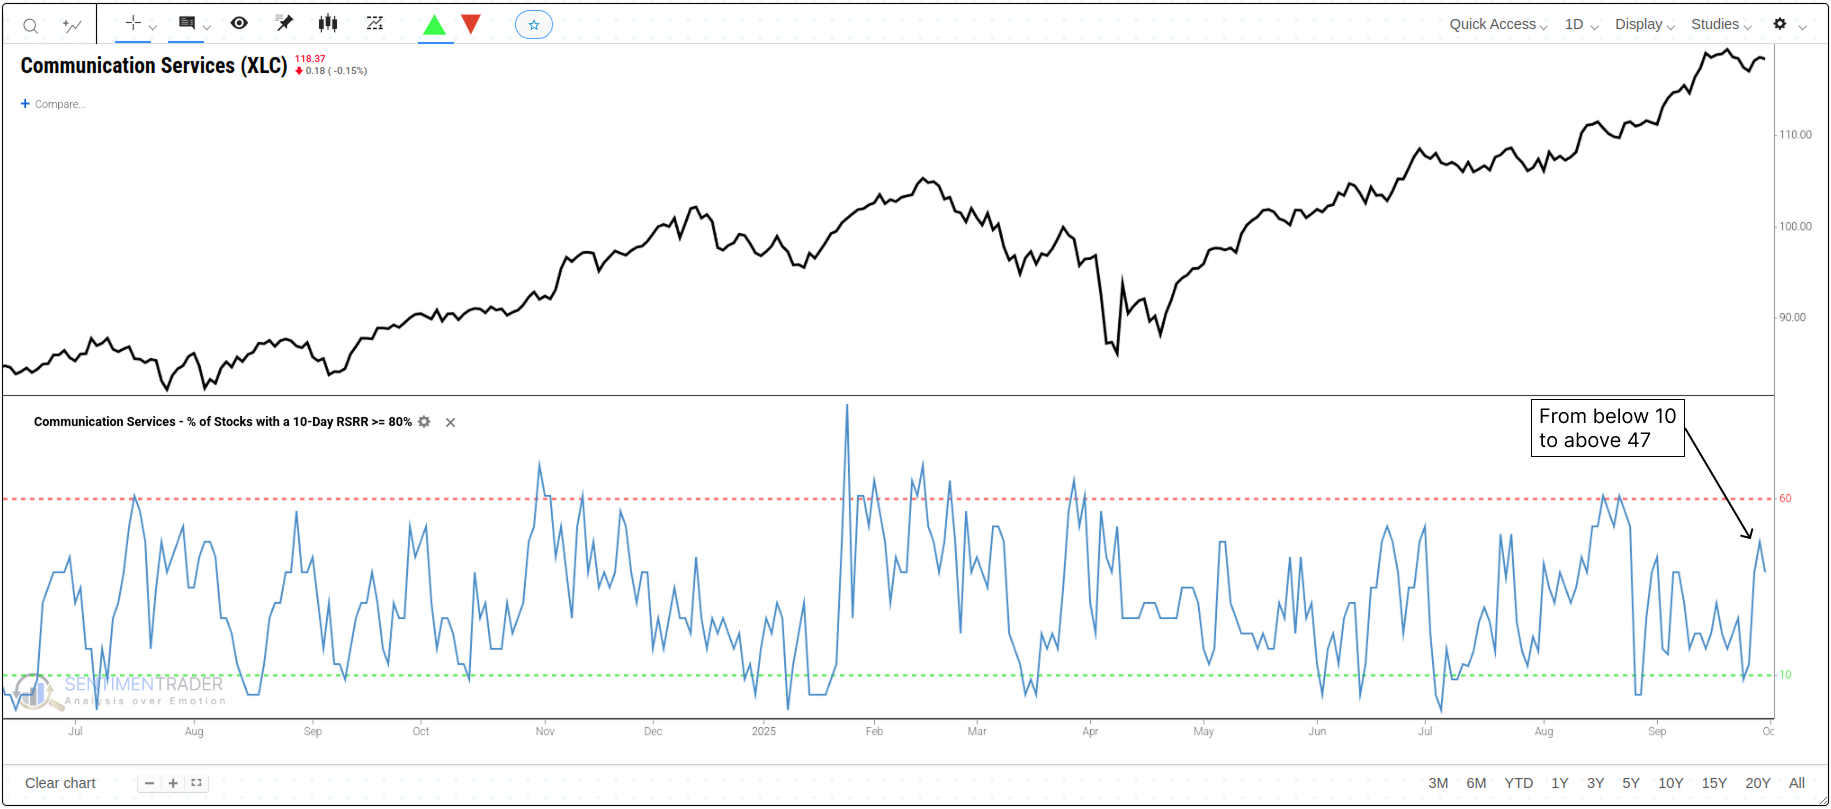
Recently, such a short-term breadth thrust signal has triggered in the Communication Services (XLC) sector, a key area of the market that includes traditional media, telecommunications, and modern internet giants. An indicator measuring the percentage of stocks with a high short-term relative strength ranking (10-Day RSRR >= 80%) has cycled from a low level of less than 10% to a reading of greater than 47%. This represents a significant and rapid improvement in the sector's internal momentum after a period of consolidation.
A historical precedent of volatility and long-term gains
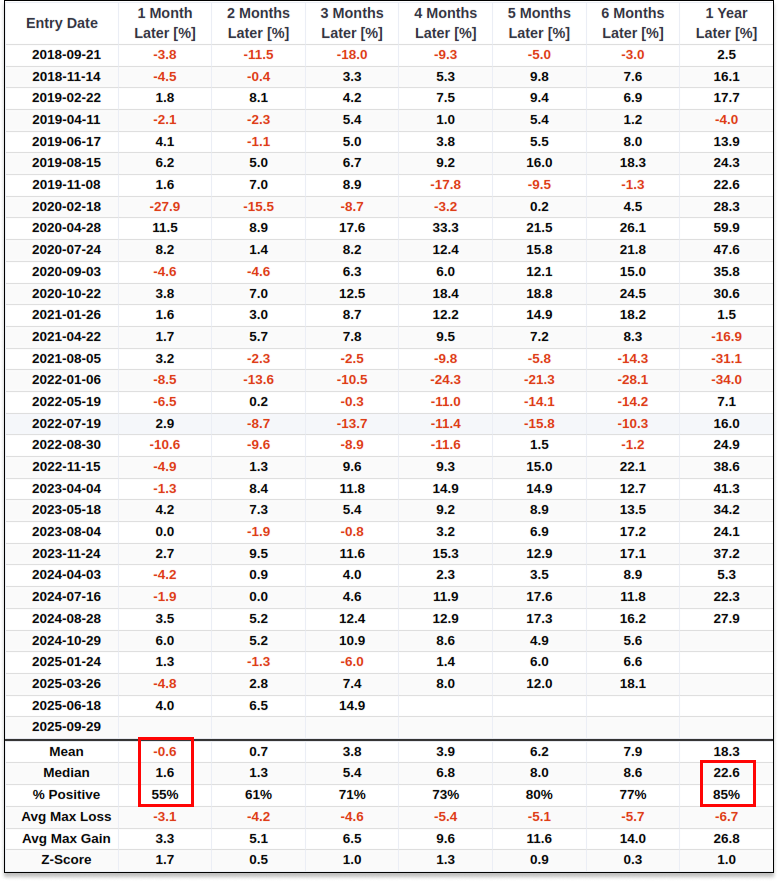
An analysis of similar breadth thrusts in the Communication Services sector reveals a complex and nuanced historical precedent. The data shows a distinct pattern characterized by initial weakness and volatility, which then gives way to strong long-term performance. The median return one month after a signal was -0.6%, with a win rate of only 55%, indicating that immediate follow-through has been lacking. However, the outlook tended to improve significantly over time. One year later, the sector showed a positive return 85% of the time, with a substantial median return of +22.6%, far outpacing the average annual return of the broader market. For related backtest, click here.
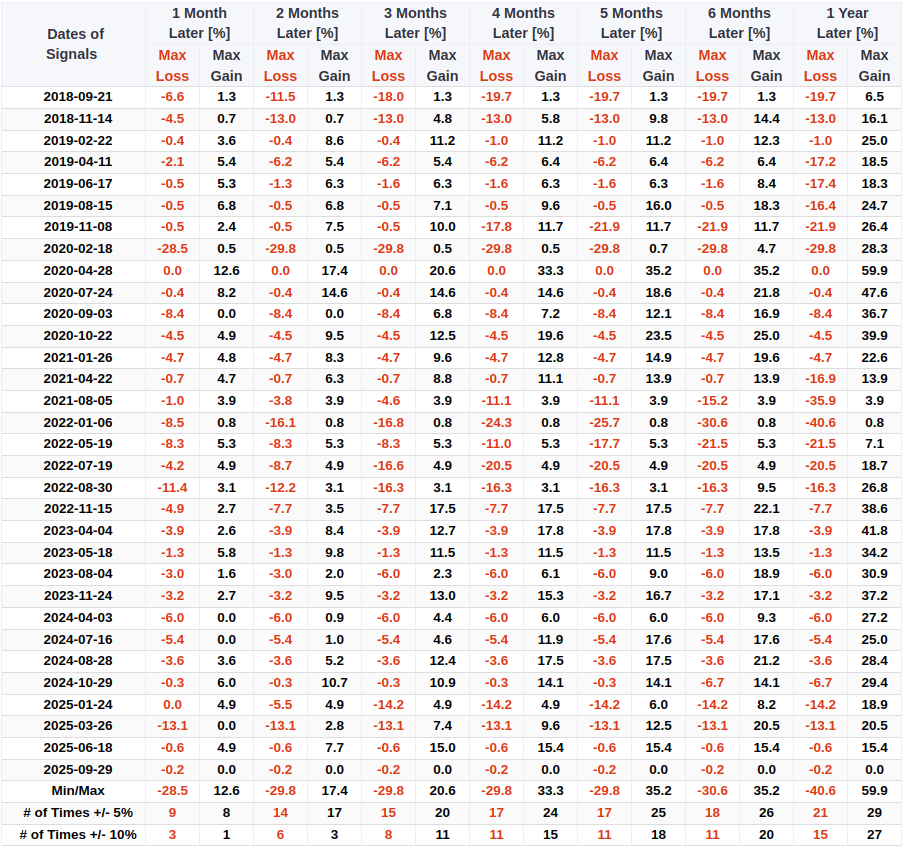
While the long-term returns are notable, the historical data also highlights a significant degree of risk that has accompanied this signal. The data is unequivocal on this point: a drawdown of more than -5% occurred in 21 of the 32 historical instances, a probability of over 65%. This indicates that while the signal has been a precursor to long-term gains, the path has often been highly volatile, suggesting the signal may mark the start of a choppy bottoming process rather than a smooth, immediate uptrend.
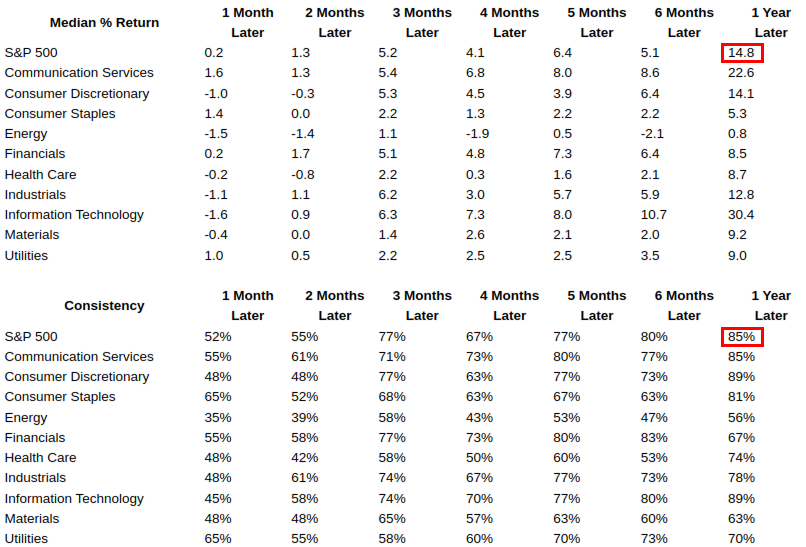
A more encouraging aspect of the signal is its historical read-through to the broader market. A breadth thrust in a major growth sector like XLC often indicates a renewed appetite for risk which can spill over into the wider market. After this signal triggered in XLC, the S&P 500 has also shown a clear tendency for positive returns. One year later, the S&P 500 had a median return of +14.8% with an 85% win rate. Other cyclical sectors, like Information Technology, also displayed strong performance, suggesting the signal has historically been consistent with a healthy broad market environment.
Identifying leadership within the sector
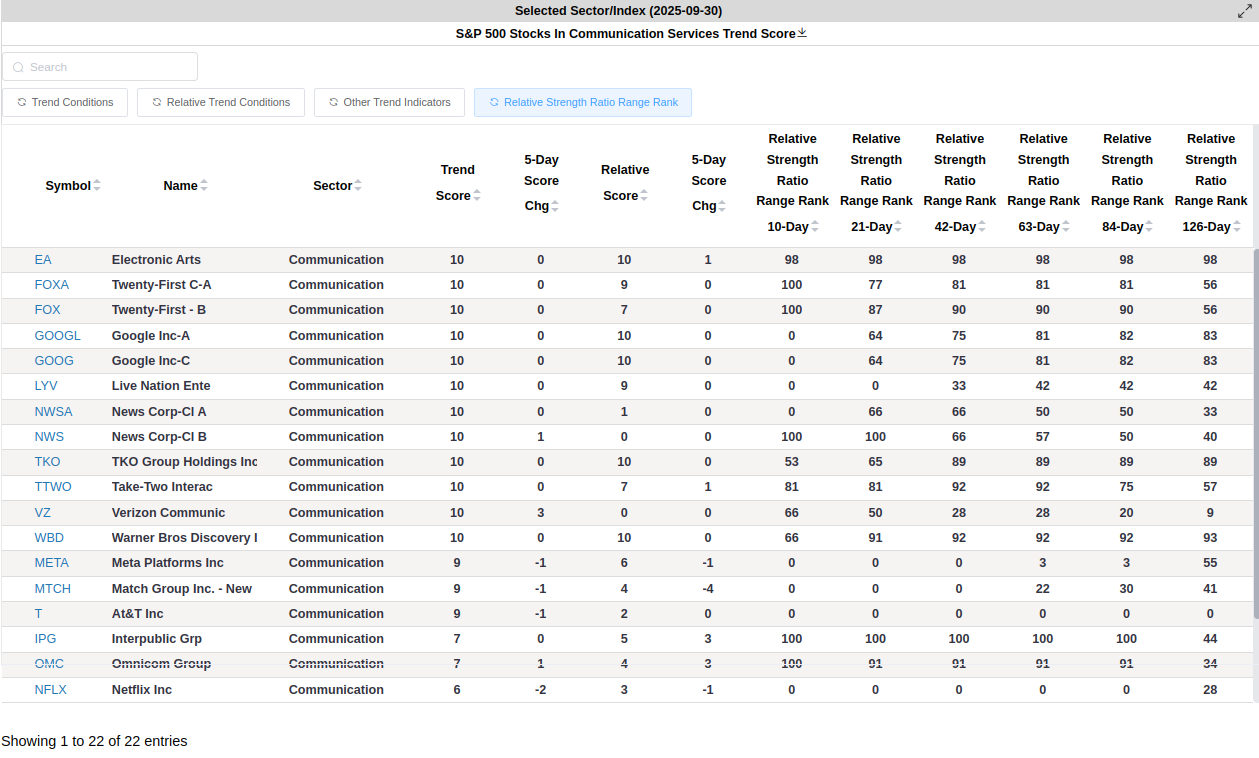
Even with a sector-wide signal, the performance among individual components can vary significantly, especially given the historical volatility. To assess the current leadership within the Communication Services sector, one can utilize tools like Trend Scores and Relative Strength Range Ranks. These metrics help to quantify the strength and consistency of a stock's trend relative to its peers. In a sector exhibiting this kind of volatile but ultimately bullish pattern, identifying the strongest individual names can be a useful exercise.
The table below offers a snapshot of the sector's internal hierarchy. For instance, we can see that companies like Electronic Arts (EA), Google (GOOGL), and Meta Platforms (META) currently exhibit high Trend Scores. Furthermore, metrics like the 21-Day and 42-Day Relative Strength Range Ranks can be used to identify stocks with strong short-to-medium-term momentum. An analysis of these scores provides a data-driven view of which components are currently leading the sector. For more information, you can visit our Trend Score page.
What the research tells us...
A short-term breadth thrust signal has triggered in the Communication Services sector, indicating a rapid expansion in the number of its components showing strong relative strength. The historical precedent following this signal presents a nuanced picture and a clear trade-off: to access the significant long-term potential returns, one would have historically had to endure a high probability of both short-term weakness and notable drawdowns. Furthermore, the signal has historically been followed by positive returns for the S&P 500, indicating it has been consistent with a healthy broad market.
In summary, the data portrays this signal not as a simple, immediate trigger for a rally, but as the potential start of what has historically been a volatile but ultimately rewarding long-term trend, both for the sector and the broader market.