Products
SentimenTrader Trading Tools
‍
Backtest Engine
My Trading Toolkit
Correlation Analysis
Seasonality
Market Prediction
Indicators & Data API
‍
Proprietary Indicators & Charts
Market Data API
Strategies & Scanner
‍
50+ Trading Strategies
Smart Stock Scanner
Smart Option Scanner
Research Reports
‍
Research Solutions
Reports Library
Free Resources
Simple Backtest Calculator
Simple Seasonality Calculator
The Kelly Criterion Calculator
Sentiment Geo Map
Public Research Reports
Education
Sentiment Indicators
Technical Indicators
Pricing
Company
About
In the News
Testimonials
Client Success Stories
Contact
Log inLoginSign up
< BACK TO ALL REPORTS

A significant imbalance in volume points to a bullish outlook for stocks

Dean Christians
2024-08-26
For only the 16th time since 1950, the NYSE up-down volume ratio surged above 10/1, with the S&P 500 less than 1% below a high. Similar volume skews led to a rise in the S&P 500 over the subsequent six months in all but one precedent.

Key points:

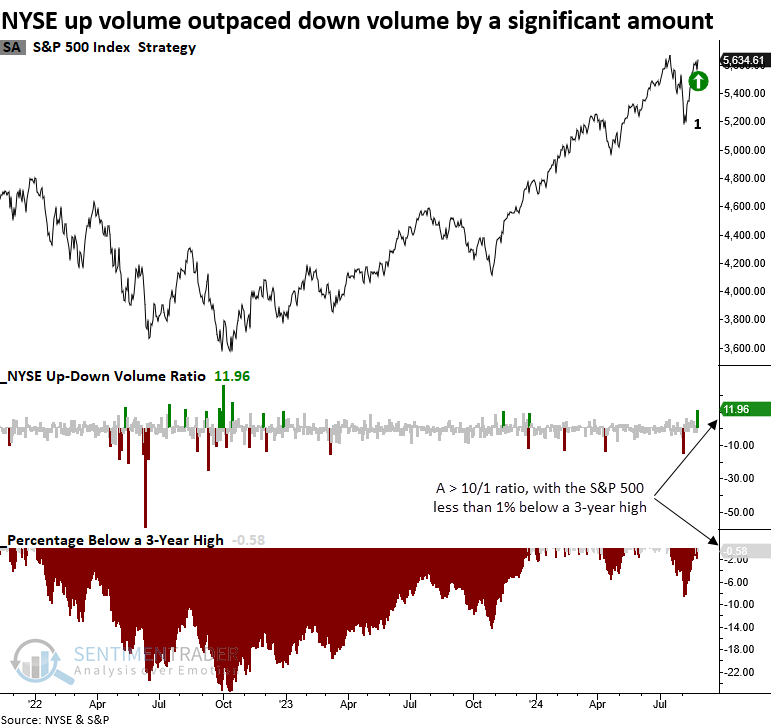
  • Volume in advancing stocks on the NYSE outpaced volume in declining stocks by a ratio of 10/1
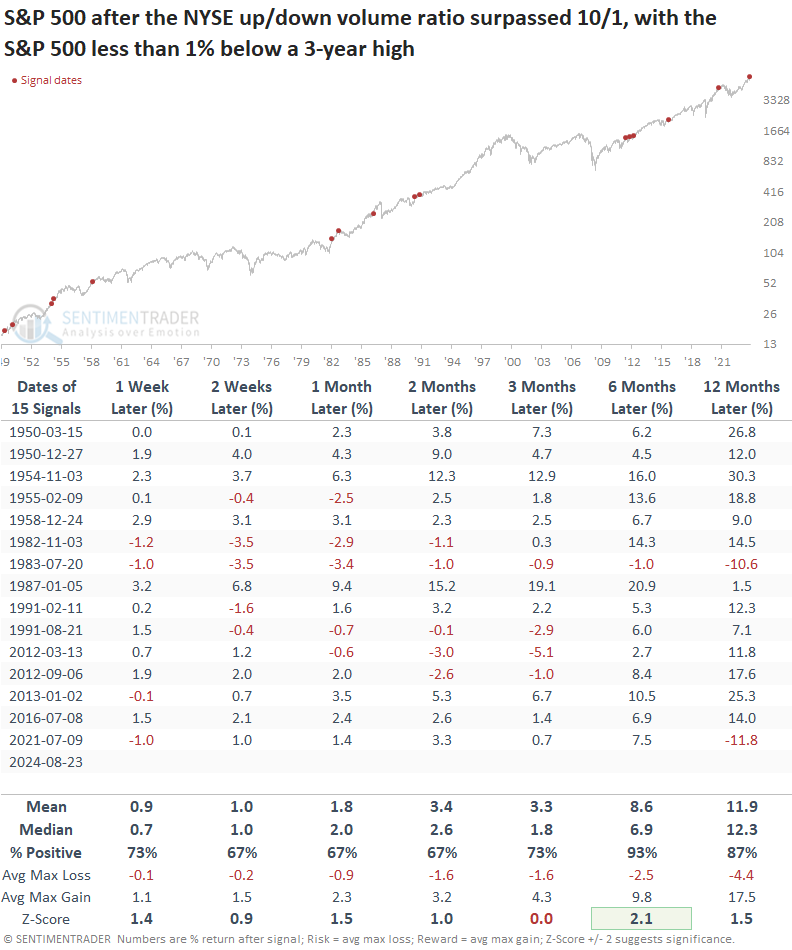
  • Similar volume skews near a high produced a 93% win rate for the S&P 500 over the next six months
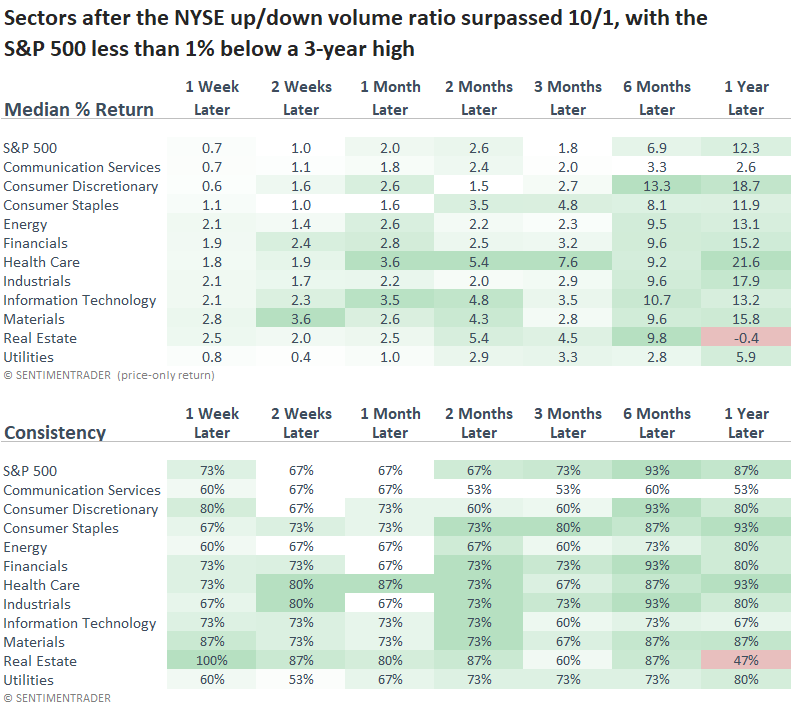
  • Growth-oriented sectors tended to outperform other groups, and the S&P 500

A volume-based indicator suggests the uptrend could persist

Over the last few weeks, the research team at Sentimentrader has highlighted numerous studies, all suggesting that the stock uptrend should resume.

The NYSE up-down volume ratio was the latest indicator to trigger an alert, surging above 10/1 on Friday. Our data shows a ratio exceeding this level on 207 occasions since 1950, when volume data became more reliable. However, context is essential. When I include a condition that requires the S&P 500 to close 1% or less from a 3-year high, the number of precedents drops to 15 other instances.

The previous lopsided skew in volume occurred in July 2021, during a steady uptrend, which produced a 7% gain in the S&P 500 over the ensuing six months.

A bullish skew in volume preceded positive returns 

Following precedents when the NYSE up-down volume ratio surpassed 10/1, with the S&P 500 less than 1% below a 3-year high, the world's most benchmarked index tended to maintain its upward bias, rising 93% of the time over the subsequent six months. Furthermore, the six-month time frame displayed significance relative to random returns. 

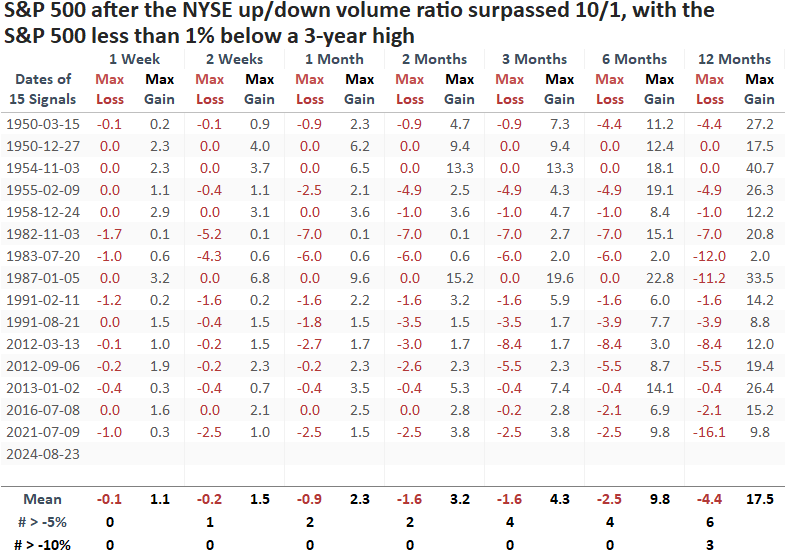
Over the next six months, the signal encountered a maximum loss exceeding -5% in 4 out of 15 cases, with no instance reaching a -10% loss, suggesting that a significant correction is less likely.

Growth-oriented sectors like Consumer Discretionary and Technology outpaced all other groups and the S&P 500 over the favorable six-month period.

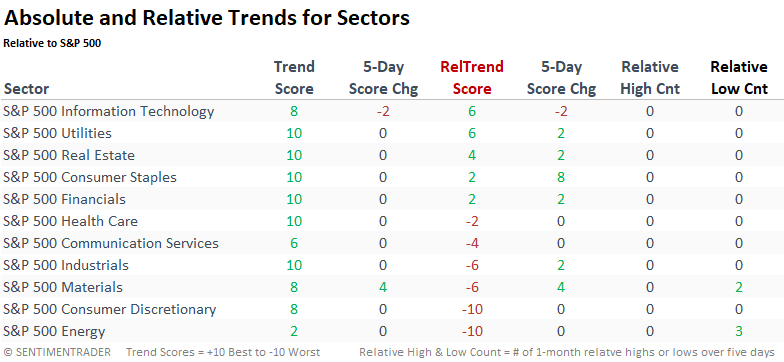
Relative trend scores 

Among all sectors, only Technology exhibits a current relative trend score consistent with the historical outlook following comparable volume ratio signals.  

What the research tells us...

Price, breadth, and sentiment-based measures suggest stocks have turned the corner following a typical bull market correction. The latest indicator to add credence to the bullish backdrop is the NYSE up-down volume ratio, which surged above 10/1. Similar precedents led to a rise in the world's most benchmarked index over the subsequent six months in all but one case. However, it's improbable that the S&P 500 and other indexes will rise in a straight line. Events such as Nvidia's earnings, the next Fed meeting, and the upcoming election could introduce some turbulence along the way. For now, the weight of the evidence continues to favor a bullish stance.

PRODUCTS
SentimenTrader
Trading Tools
Indicators & Data API
‍
Strategies & Scanner
‍
Research Reports
FREE
RESOUrCES
Simple Backtest
Calculator
Simple Seasonality
Calculator
The Kelly Criterion
Calculator
Sentiment Geo Map
‍
Public Research Reports
‍
Education
Sentiment Indicators
‍
Technical Indicators
‍
Pricing
Bundle pricing
‍
FAQ
‍
Announcements
‍
COMPANY
‍
About
‍
In the News
‍
Testimonials
‍
Client Success Stories
CONTACT
‍
General Inquiries
‍
Media Inquiries
‍
Financial Professionals Inquiries
‍
© 2026 Sundial Capital Research Inc. All rights reserved.
Setsail Marketing
TermsPrivacyAffiliate Program
Risk Disclosure: The information and tools provided are for research and analytical purposes only and are not intended as investment advice. Market analysis involves uncertainty, and outcomes may differ from expectations. Users should conduct their own due diligence and consider their individual circumstances before making any financial decisions. Past performance is not necessarily indicative of future results.

Hypothetical Performance Disclosure: Hypothetical performance results have many inherent limitations, some of which are described below. No representation is being made that any account will or is likely to achieve profits or losses similar to those shown; in fact, there are frequently sharp differences between hypothetical performance results and the actual results subsequently achieved by any particular trading program. One of the limitations of hypothetical performance results is that they are generally prepared with the benefit of hindsight. In addition, hypothetical trading does not involve financial risk, and no hypothetical trading record can completely account for the impact of financial risk of actual trading. for example, the ability to withstand losses or to adhere to a particular trading program in spite of trading losses are material points which can also adversely affect actual trading results. There are numerous other factors related to the markets in general or to the implementation of any specific trading program which cannot be fully accounted for in the preparation of hypothetical performance results and all which can adversely affect trading results.

Testimonial Disclosure: Testimonials appearing on this website may not be representative of other clients or customers and is not a guarantee of future performance or success.