Products
SentimenTrader Trading Tools
‍
Backtest Engine
My Trading Toolkit
Correlation Analysis
Seasonality
Market Prediction
Indicators & Data API
‍
Proprietary Indicators & Charts
Market Data API
Strategies & Scanner
‍
50+ Trading Strategies
Smart Stock Scanner
Smart Option Scanner
Research Reports
‍
Research Solutions
Reports Library
Free Resources
Simple Backtest Calculator
Simple Seasonality Calculator
The Kelly Criterion Calculator
Sentiment Geo Map
Public Research Reports
Education
Sentiment Indicators
Technical Indicators
Pricing
Company
About
In the News
Testimonials
Client Success Stories
Contact
Log inLoginSign up
< BACK TO ALL REPORTS

A significant divergence between the S&P 500 and stock uptrends

Dean Christians
2023-10-26
Fewer than 27% of S&P 500 stocks are trading above their 200-day average as the index remains within 10% of its most recent 252-day high. Similar divergences between the index and its stocks suggest caution.

Key points:

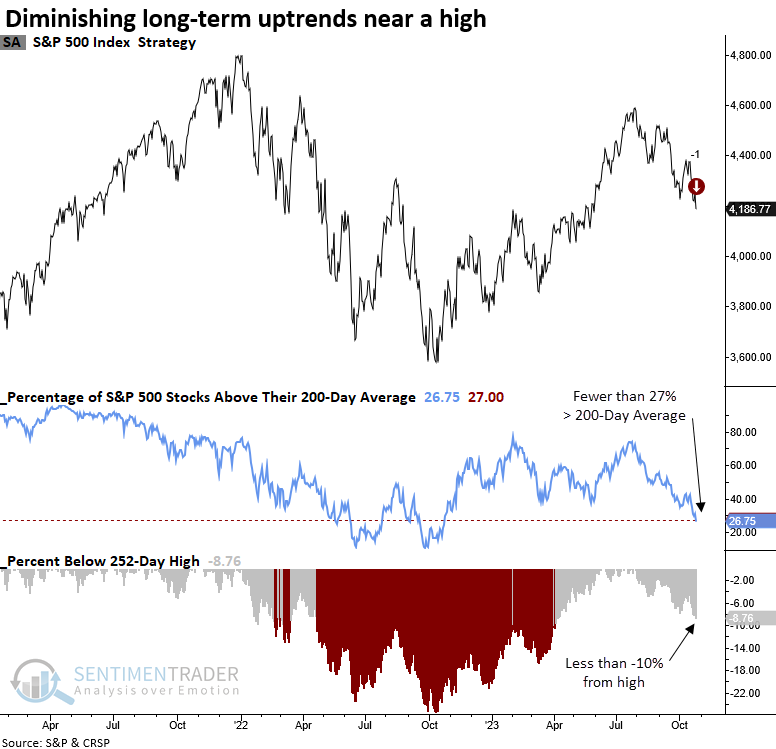
  • The percentage of S&P 500 stocks above their 200-day average declined below 27%
  • At the same time, the S&P 500 remains less than 10% below its 252-day high
  • Similar precedents led to lackluster results for the S&P 500 over the following six months

The impact of higher yields is weighing on long-term uptrends for S&P 500 stocks

On Wednesday, I published a research note highlighting the deteriorating long-term uptrend backdrop for common stocks listed on the New York Stock Exchange.

While reviewing S&P 500 market breadth data, I noticed a similar trend, with fewer than 27% of the constituent stocks trading above their 200-day average. However, what caught my attention the most was that so few stocks remained in a long-term uptrend as the S&P 500 was still trading within 10% of its last 252-day high.

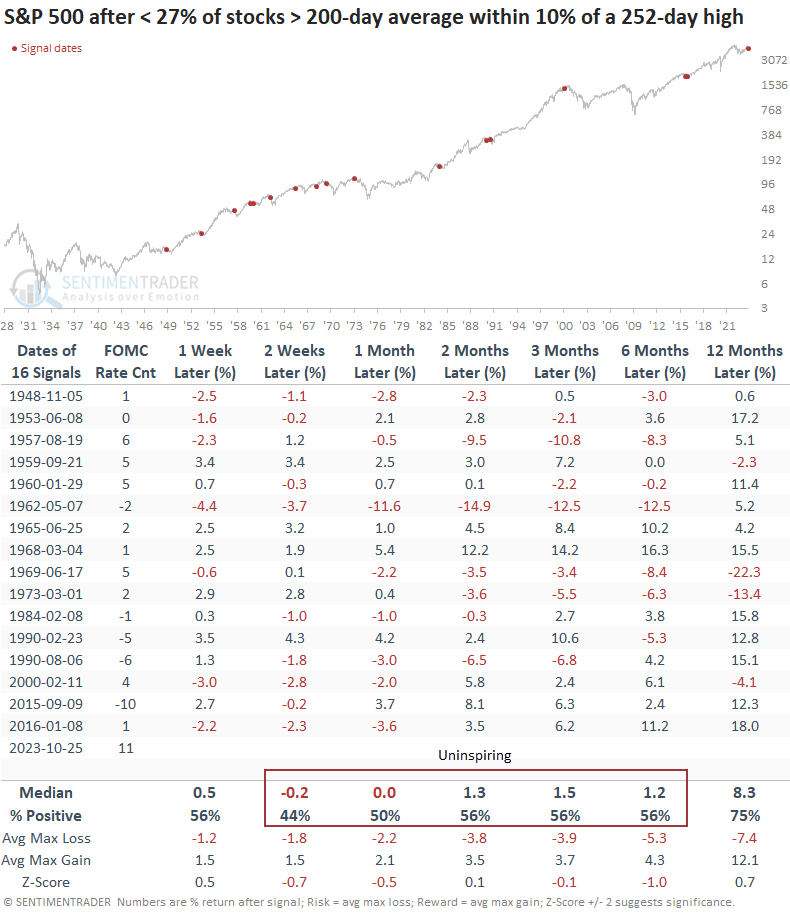
This type of divergence between the index and its member stocks has only occurred 16 other times since 1928.

Similar participation trends near a high suggest a sluggish outlook

Whenever the S&P 500 hovers within 10% of its 252-day high and less than 27% of its constituent stocks are trading above their 200-day averages, the world's most widely followed index typically encounters difficulties in the subsequent six months. Over that same time frame, the average max loss exceeded the average max gain in all but one period.

In 11 out of 16 cases, the Federal Reserve was increasing its target rate. Tightening cycles typically weigh on interest rate-sensitive stocks, resulting in a narrowing of market breadth. This time is no different.

The danger zone

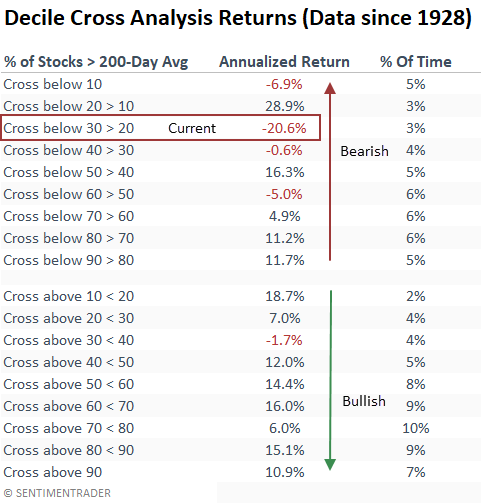
Similar to the NYSE analysis table shared on Wednesday, the annualized returns for the S&P 500 often exhibit less favorable returns when the percentage of stocks above their long-term average declines in oversold territory.

The current decile cross displays the worst annualized return outlook of any zone.

A more concerning potential outlook

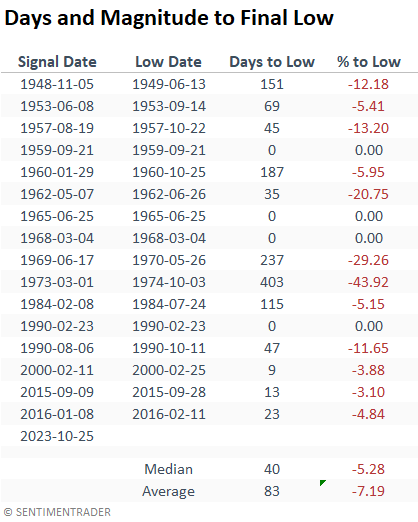
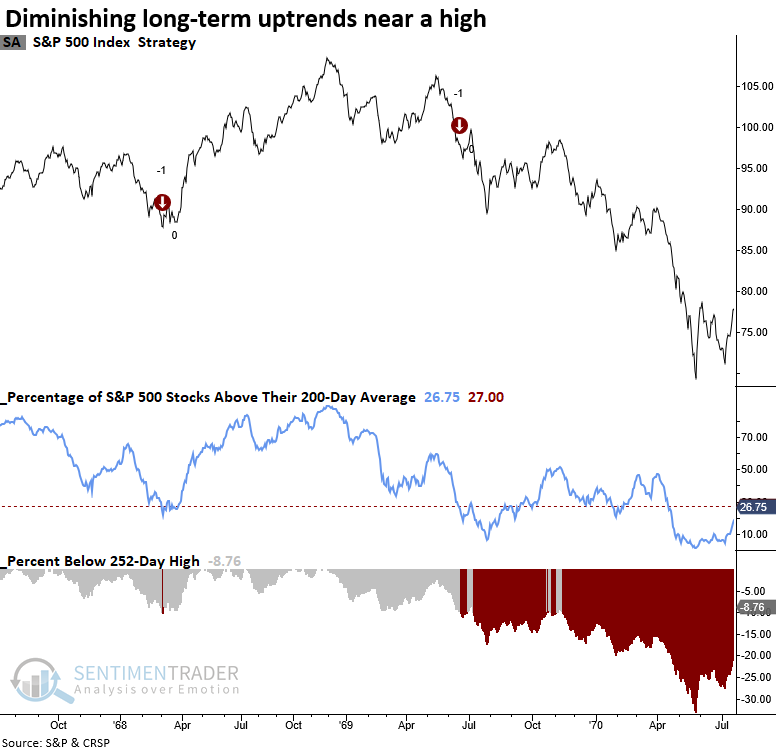
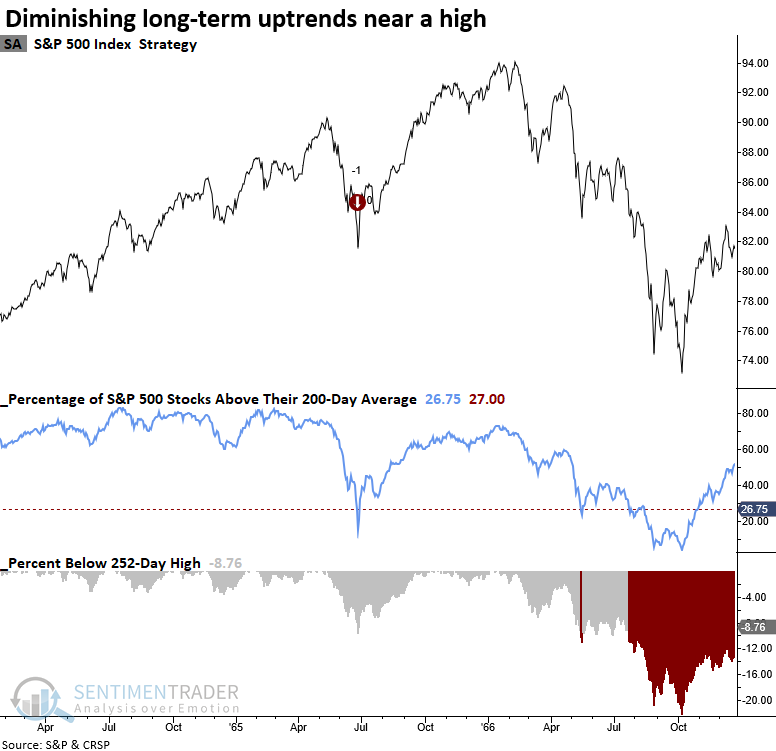
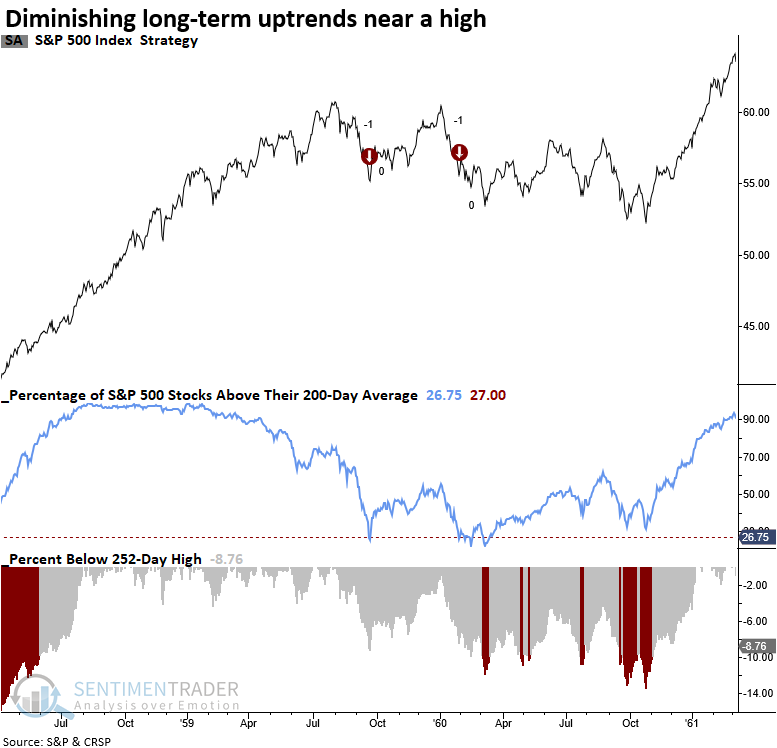
When I calculate the days and percentage change from the signal date to the low in the S&P 500, potential downside risk looks more troubling than the results in the outlook table. The instances in 1965 and 1968 are the only times the S&P 500 bottomed on the alert date and rocketed higher. While the precedents in 1959 and February 1990 were bottoms, it was within the context of an overall topping process.

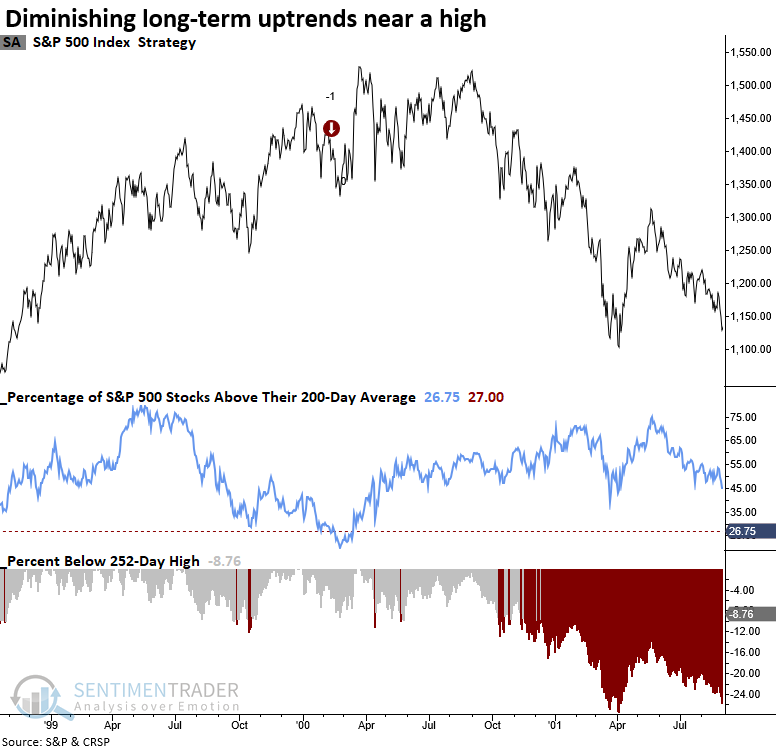
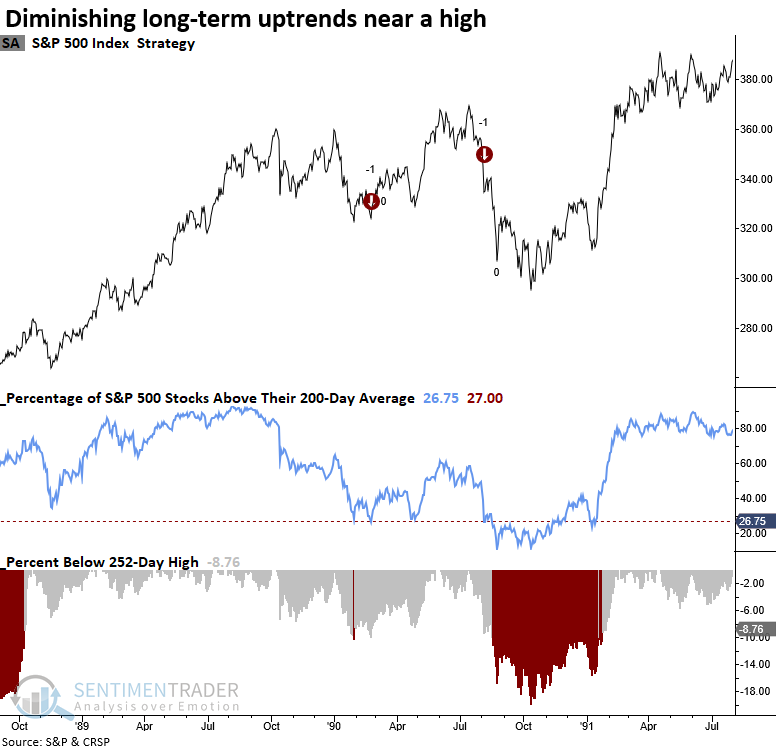
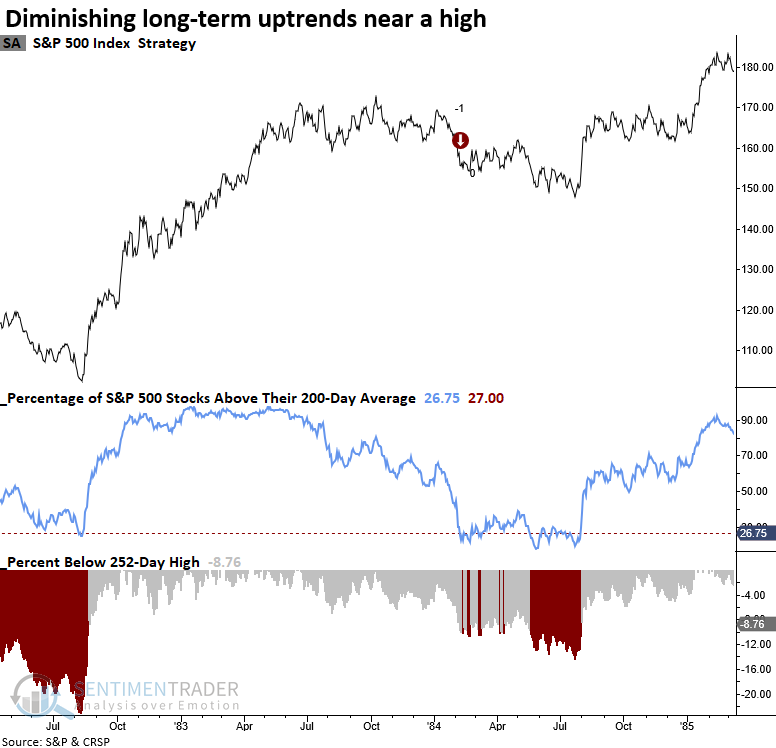
Other historical chart examples

What the research tells us...

Determining the difference between a correction and the start of a bear market using market breadth indicators is a challenge. They look very similar at the outset. The more context, the better. As an increasing number of S&P 500 stocks fail to maintain a long-term uptrend, with the S&P 500 hovering within 10% of its 252-day high, all is not well with market breadth. Similar backdrops suggest the S&P 500 could struggle over the subsequent six months. For now, it's best to avoid catching the falling knife.

PRODUCTS
SentimenTrader
Trading Tools
Indicators & Data API
‍
Strategies & Scanner
‍
Research Reports
FREE
RESOUrCES
Simple Backtest
Calculator
Simple Seasonality
Calculator
The Kelly Criterion
Calculator
Sentiment Geo Map
‍
Public Research Reports
‍
Education
Sentiment Indicators
‍
Technical Indicators
‍
Pricing
Bundle pricing
‍
FAQ
‍
Announcements
‍
COMPANY
‍
About
‍
In the News
‍
Testimonials
‍
Client Success Stories
CONTACT
‍
General Inquiries
‍
Media Inquiries
‍
Financial Professionals Inquiries
‍
© 2026 Sundial Capital Research Inc. All rights reserved.
Setsail Marketing
TermsPrivacyAffiliate Program
Risk Disclosure: The information and tools provided are for research and analytical purposes only and are not intended as investment advice. Market analysis involves uncertainty, and outcomes may differ from expectations. Users should conduct their own due diligence and consider their individual circumstances before making any financial decisions. Past performance is not necessarily indicative of future results.

Hypothetical Performance Disclosure: Hypothetical performance results have many inherent limitations, some of which are described below. No representation is being made that any account will or is likely to achieve profits or losses similar to those shown; in fact, there are frequently sharp differences between hypothetical performance results and the actual results subsequently achieved by any particular trading program. One of the limitations of hypothetical performance results is that they are generally prepared with the benefit of hindsight. In addition, hypothetical trading does not involve financial risk, and no hypothetical trading record can completely account for the impact of financial risk of actual trading. for example, the ability to withstand losses or to adhere to a particular trading program in spite of trading losses are material points which can also adversely affect actual trading results. There are numerous other factors related to the markets in general or to the implementation of any specific trading program which cannot be fully accounted for in the preparation of hypothetical performance results and all which can adversely affect trading results.

Testimonial Disclosure: Testimonials appearing on this website may not be representative of other clients or customers and is not a guarantee of future performance or success.