
A significant divergence between the broad market and the energy sector

Key points:
- The spread between S&P 500 stocks and S&P 500 Energy stocks in an uptrend widened to a historic level
- Similar divergences foreshadowed an S&P 500 rally over the next few months, but with a caveat
- The Energy sector somewhat struggles over the subsequent months, suggesting potential sector rotation
A troubling long-term trend divergence worth noting
I published a research note on Monday highlighting a buy signal for the S&P 500 energy sector based on the aggregated put/call ratio. I also acknowledge that the events in the Middle East most likely influenced the alert. However, before the turmoil, market breadth indicators for the energy sector had been improving, suggesting a more favorable backdrop for energy stocks.
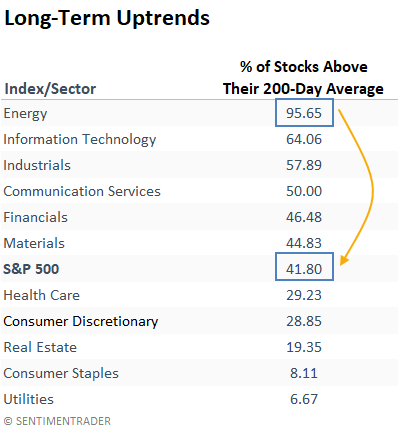
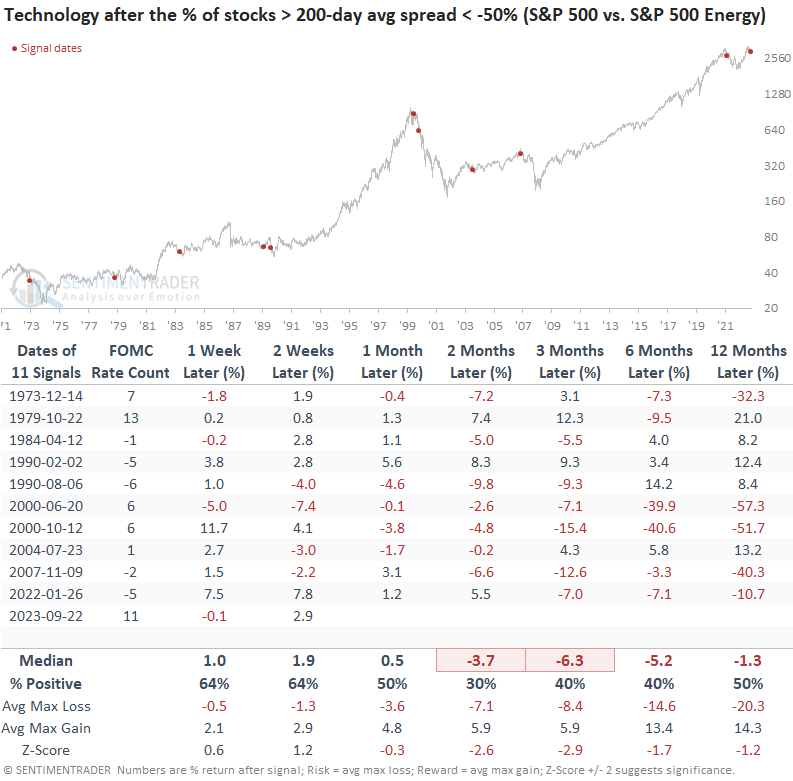
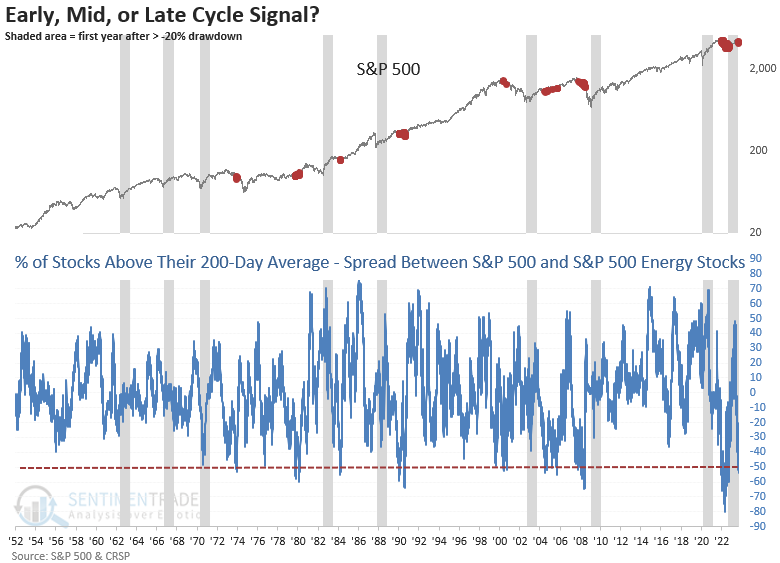
While long-term uptrends in the energy sector have improved, just about every other group has seen significant deterioration. On Tuesday, the spread between S&P 500 stocks trading above their 200-day average and S&P 500 Energy sector stocks above their long-term average widened to the most substantial gap in 2023, with a reading of -53%.
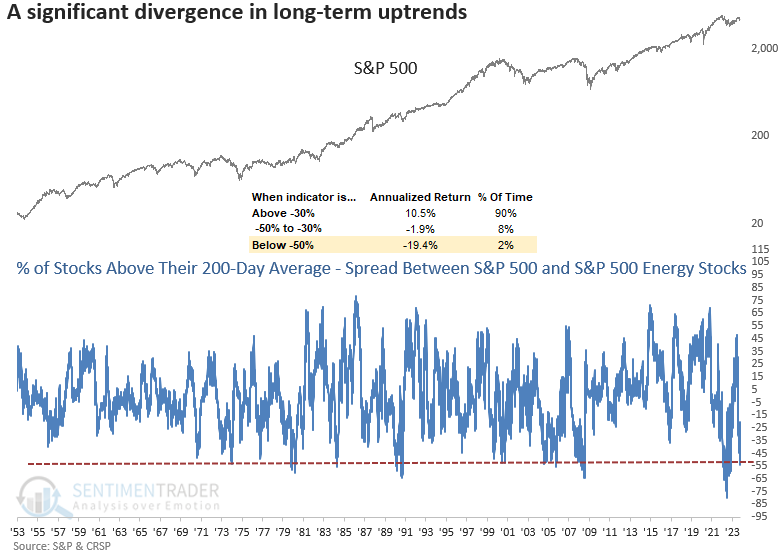
The widest spread in the 70-year history of the data occurred in 2022, when energy stocks thrived, and most other groups experienced significant drawdowns.
Although infrequent, a substantial divergence in long-term uptrends between S&P 500 stocks and S&P 500 Energy sector stocks tends to result in unfavorable annualized returns for the world's most benchmarked index.
Similar divergences suggest a potential rally, but the big-picture backdrop is a concern
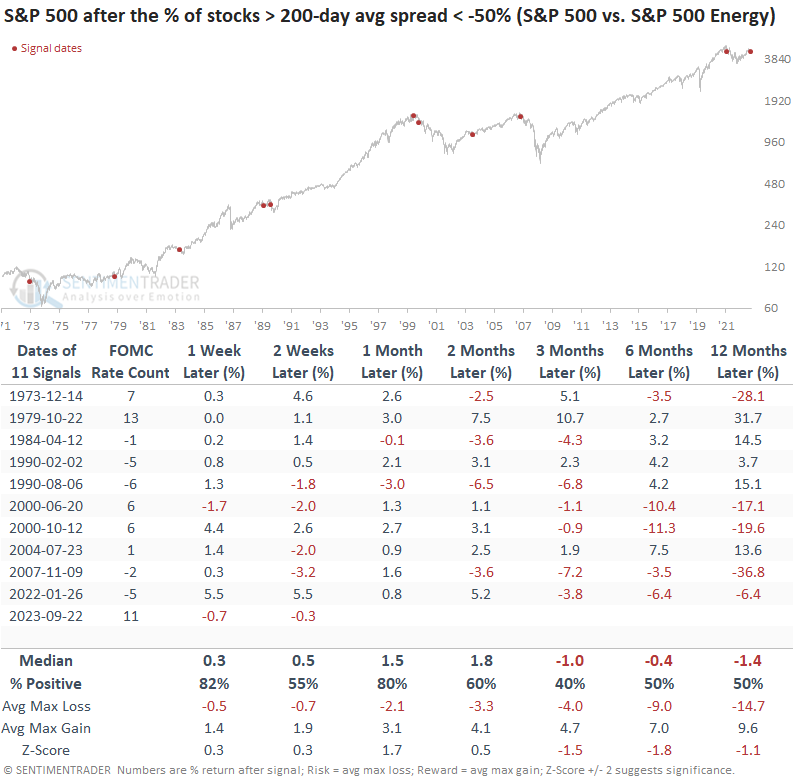
The divergence in uptrends is indicative of an oversold condition for most stocks outside of the energy sector. Therefore, it's not surprising to see the S&P 500 rally over the subsequent few months, with a decent batting average. However, we need to be mindful that several signals were triggered near market peaks or within the context of significant drawdown periods.
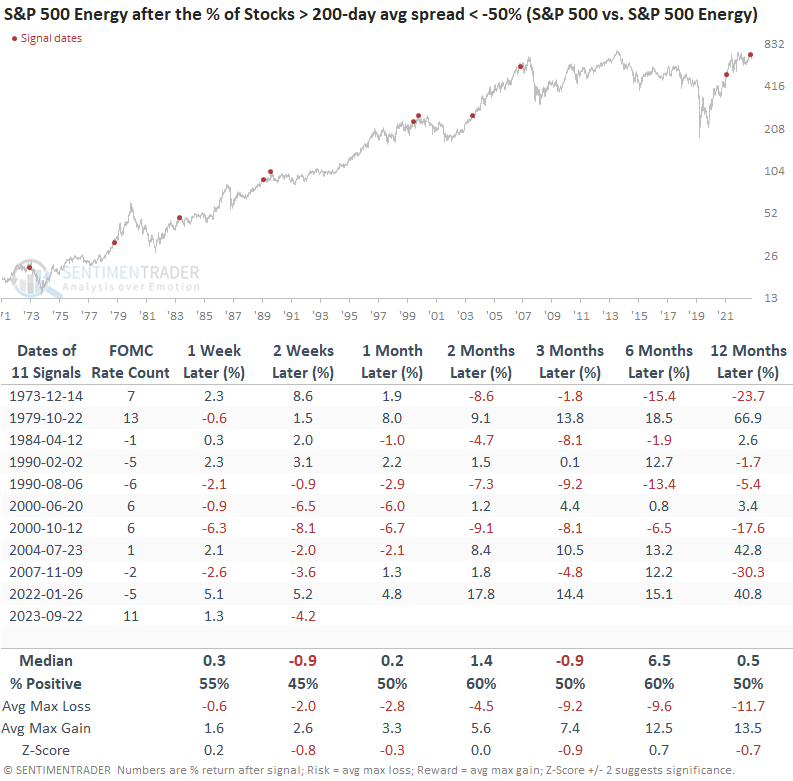
Despite a significant number of energy stocks maintaining bullish long-term uptrends, the sector somewhat struggled over the next three months, potentially suggesting investors reduced exposure to the group in favor of other beaten-down sectors.
Should the market find itself in a situation reminiscent of 2022, with a persistent spread below -50%, Technology could encounter difficulties, as historical data suggests.
Where are we in the business cycle?
The recent dip below -50% in the spread has never occurred during the initial year of a new bull market, indicating a business cycle more indicative of the mid to late stages.
What the research tells us...
A spread that measures the difference between the percentage of S&P 500 stocks trading above their 200-day average and the percentage of S&P 500 Energy stocks above their long-term average fell below -50%, a level associated with poor annualized returns should the spread persist for an extended period. A simple crossover method for analyzing forward returns suggests the S&P 500 can rally for a few months. Still, one must be mindful that this type of breadth divergence has occurred near significant market peaks or within the context of drawdowns.
Should a Q4 rally develop, it will be imperative that a majority of stocks participate.