
A significant breakout in the S&P 500 Energy sector

Key points:
- The S&P 500 Energy sector closed at a new 9-year high
- After similar breakouts, the group was higher at some point over the ensuing six months every time
- The breakout in the energy sector did not foreshadow a resurgence in inflation in more recent times
The S&P 500 Energy sector joins the breakout club
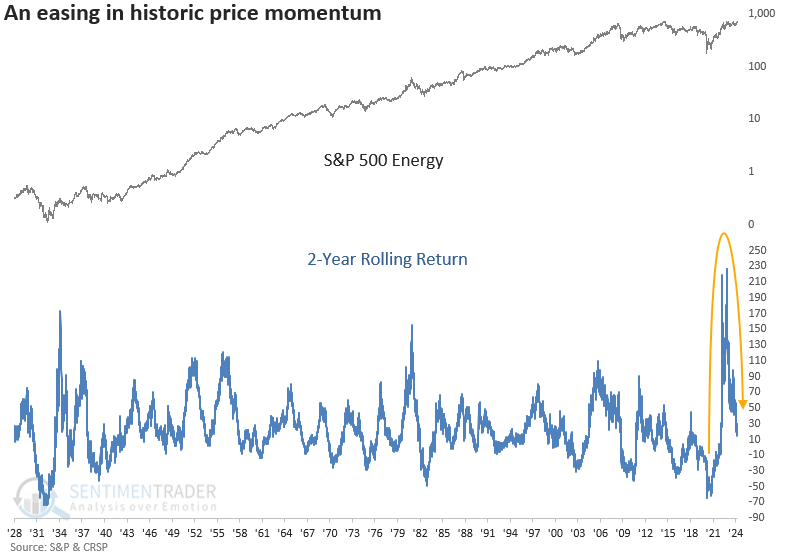
Following its record-breaking two-year return, the S&P 500 Energy sector underwent a 341-session consolidation period beneath the multi-year peak set during that remarkable surge. However, Friday saw it surpass that milestone, marking a nine-year breakout and edging within a mere 2% of the all-time high attained back in June 2014.
The new high in the energy sector is not all that surprising, given the recent breadth thrust and advance-decline line breakout, suggesting the potential for a fresh peak.
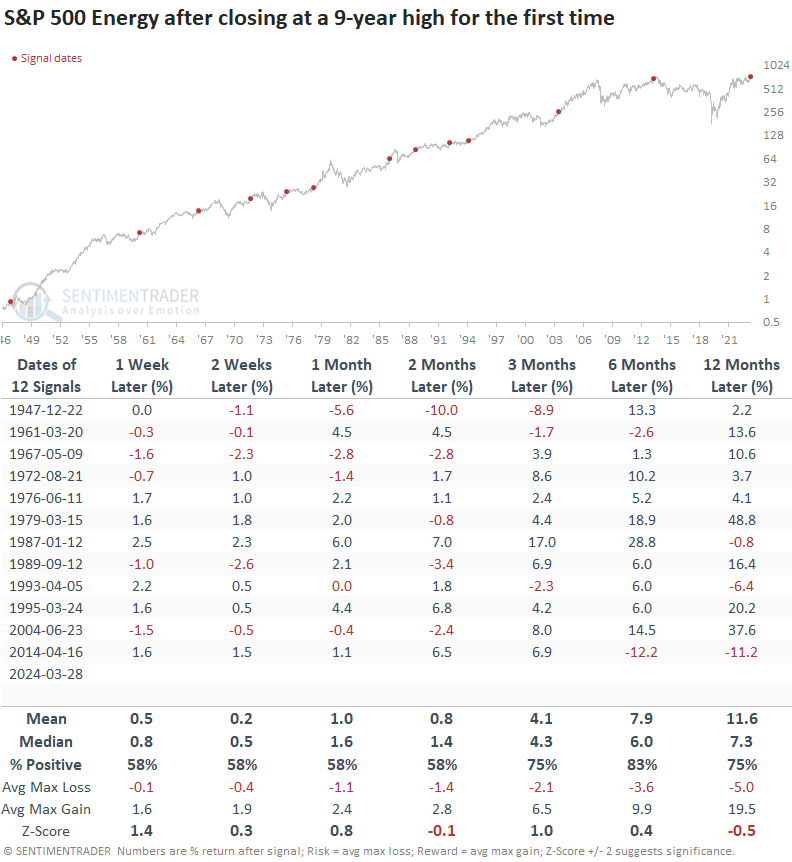
Similar breakouts suggest the energy sector can trend higher
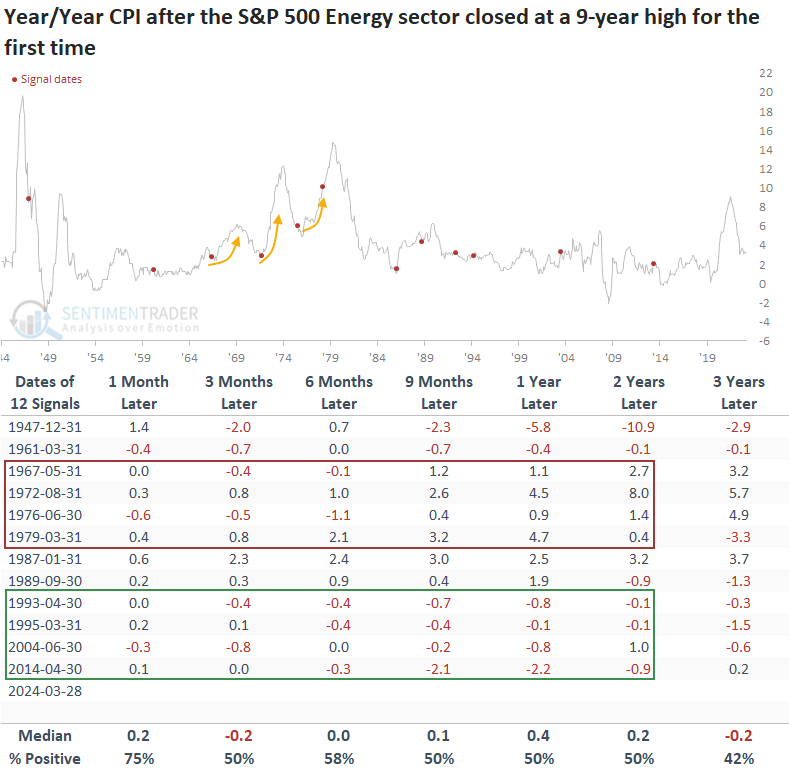
Once the S&P 500 Energy sector attained a 9-year high for the first time, the group tended to rise over the following 12 months. The likelihood of a false breakout appears low, with only one signal, 1947, showing a meaningful pullback over the ensuing two months.
In 2014, the sector gained 9.4% before eventually peaking two months later, which coincided with the all-time high.
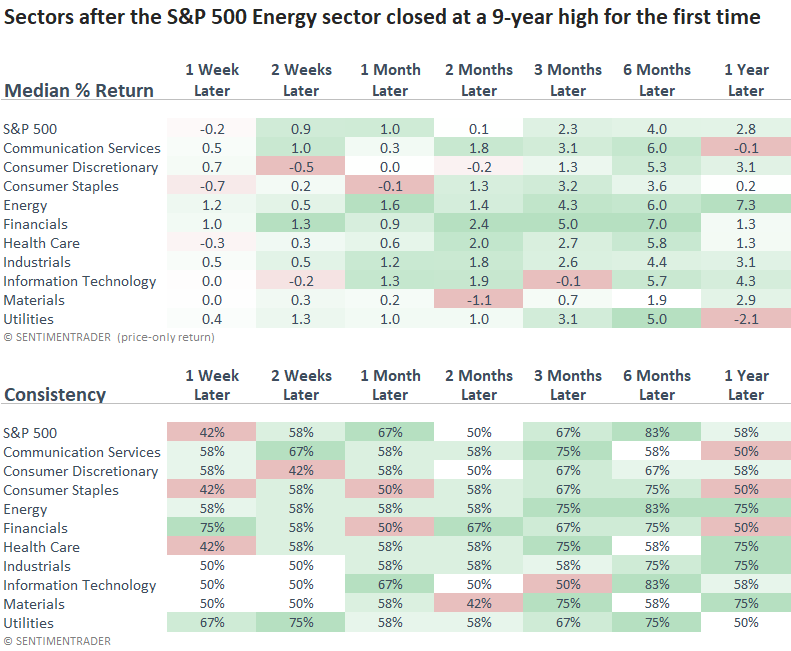
Long-term breakouts in the energy sector, like now, suggest the group outperforms the S&P 500 and other sectors over the following year.
It's worth mentioning that the S&P 500's annual return of 2.8% and win rate of 58% notably lagged behind the study period's outcomes of 7.5% and 73%. So, one could make the case that transitioning to an energy-led bull market impacts the broad market.
However, this single event contradicts the findings from numerous recent studies we've discussed, which suggested that the weight of the evidence is still overwhelmingly bullish for the world's most benchmarked index.
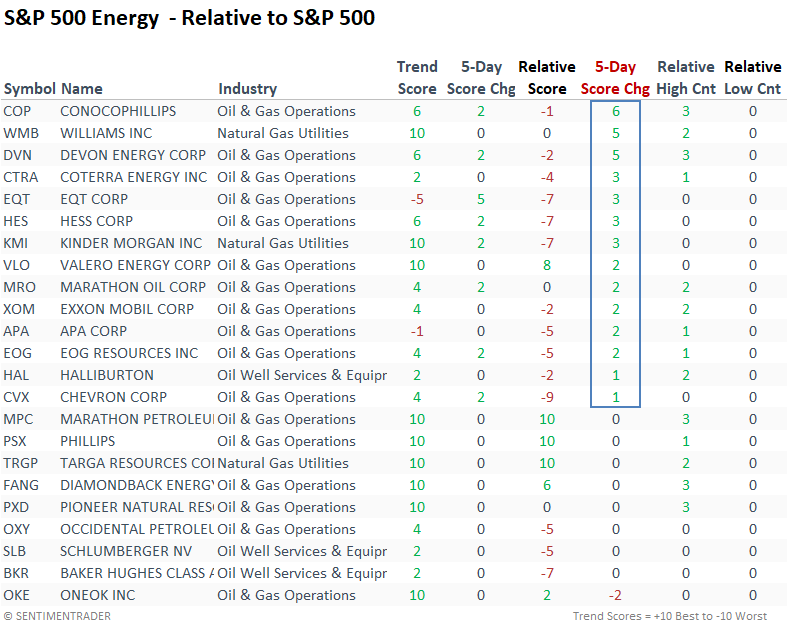
Absolute and relative trend scores
The Energy sector has shown a noticeable improvement in the percentage of stocks with a positive absolute trend score, ranking as the second-highest group. However, it lags in other categories, especially on a relative basis. So, it's still a sector that I would examine on a stock-by-stock basis rather than owning a broad ETF.
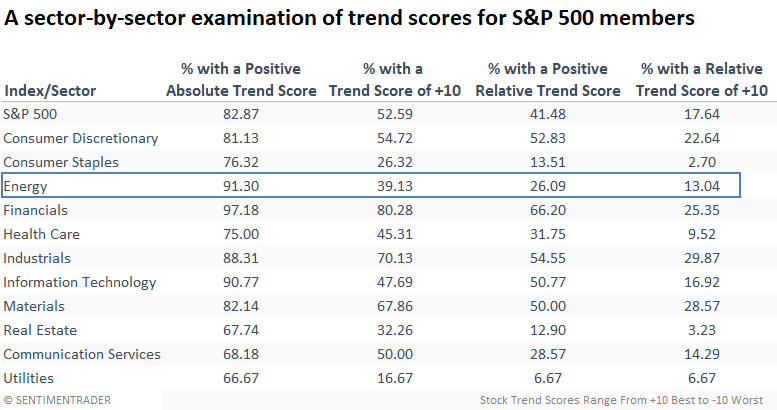
While relative trends for Conoco Phillips, Williams, and Devon Energy remain unfavorable, their scores increased noticeably week over week.
Could the breakout in the Energy sector foreshadow a second wave in inflation?
One risk to the cyclical upswing in stocks would be a resurgence in inflation that forces the Fed to backtrack on cutting rates and even potentially reengage the tightening cycle. Mind you, this narrative is from the perma-bear crowd that has been shouting fire in the theater for the last year.
A 9-year breakout did a pretty good job of foreshadowing higher year-over-year CPI during the inflationary period between 1966 and 1982. However, that's not the case starting in the 1990s. So, your guess is as good as mine.
What the research tells us...
The S&P 500 Energy sector reached a 9-year high following bullish breadth-based signals. After similar precedents, the industry was higher at some point over the ensuing six months every time. From a relative perspective, energy outperformed the S&P 500 and all other sectors a year later. However, current trends in the energy sector do not align with historical tendencies following similar precedents. Therefore, investors should be patient and tread lightly in the group until we see a noticeable improvement in relative trends. Whether the breakout in energy foreshadows a second wave of inflation is inconclusive. Still, I would watch closely.