
A Signal of Strength and Stability: This RSI Streak Has Rarely Preceded a Major Decline

Key points:
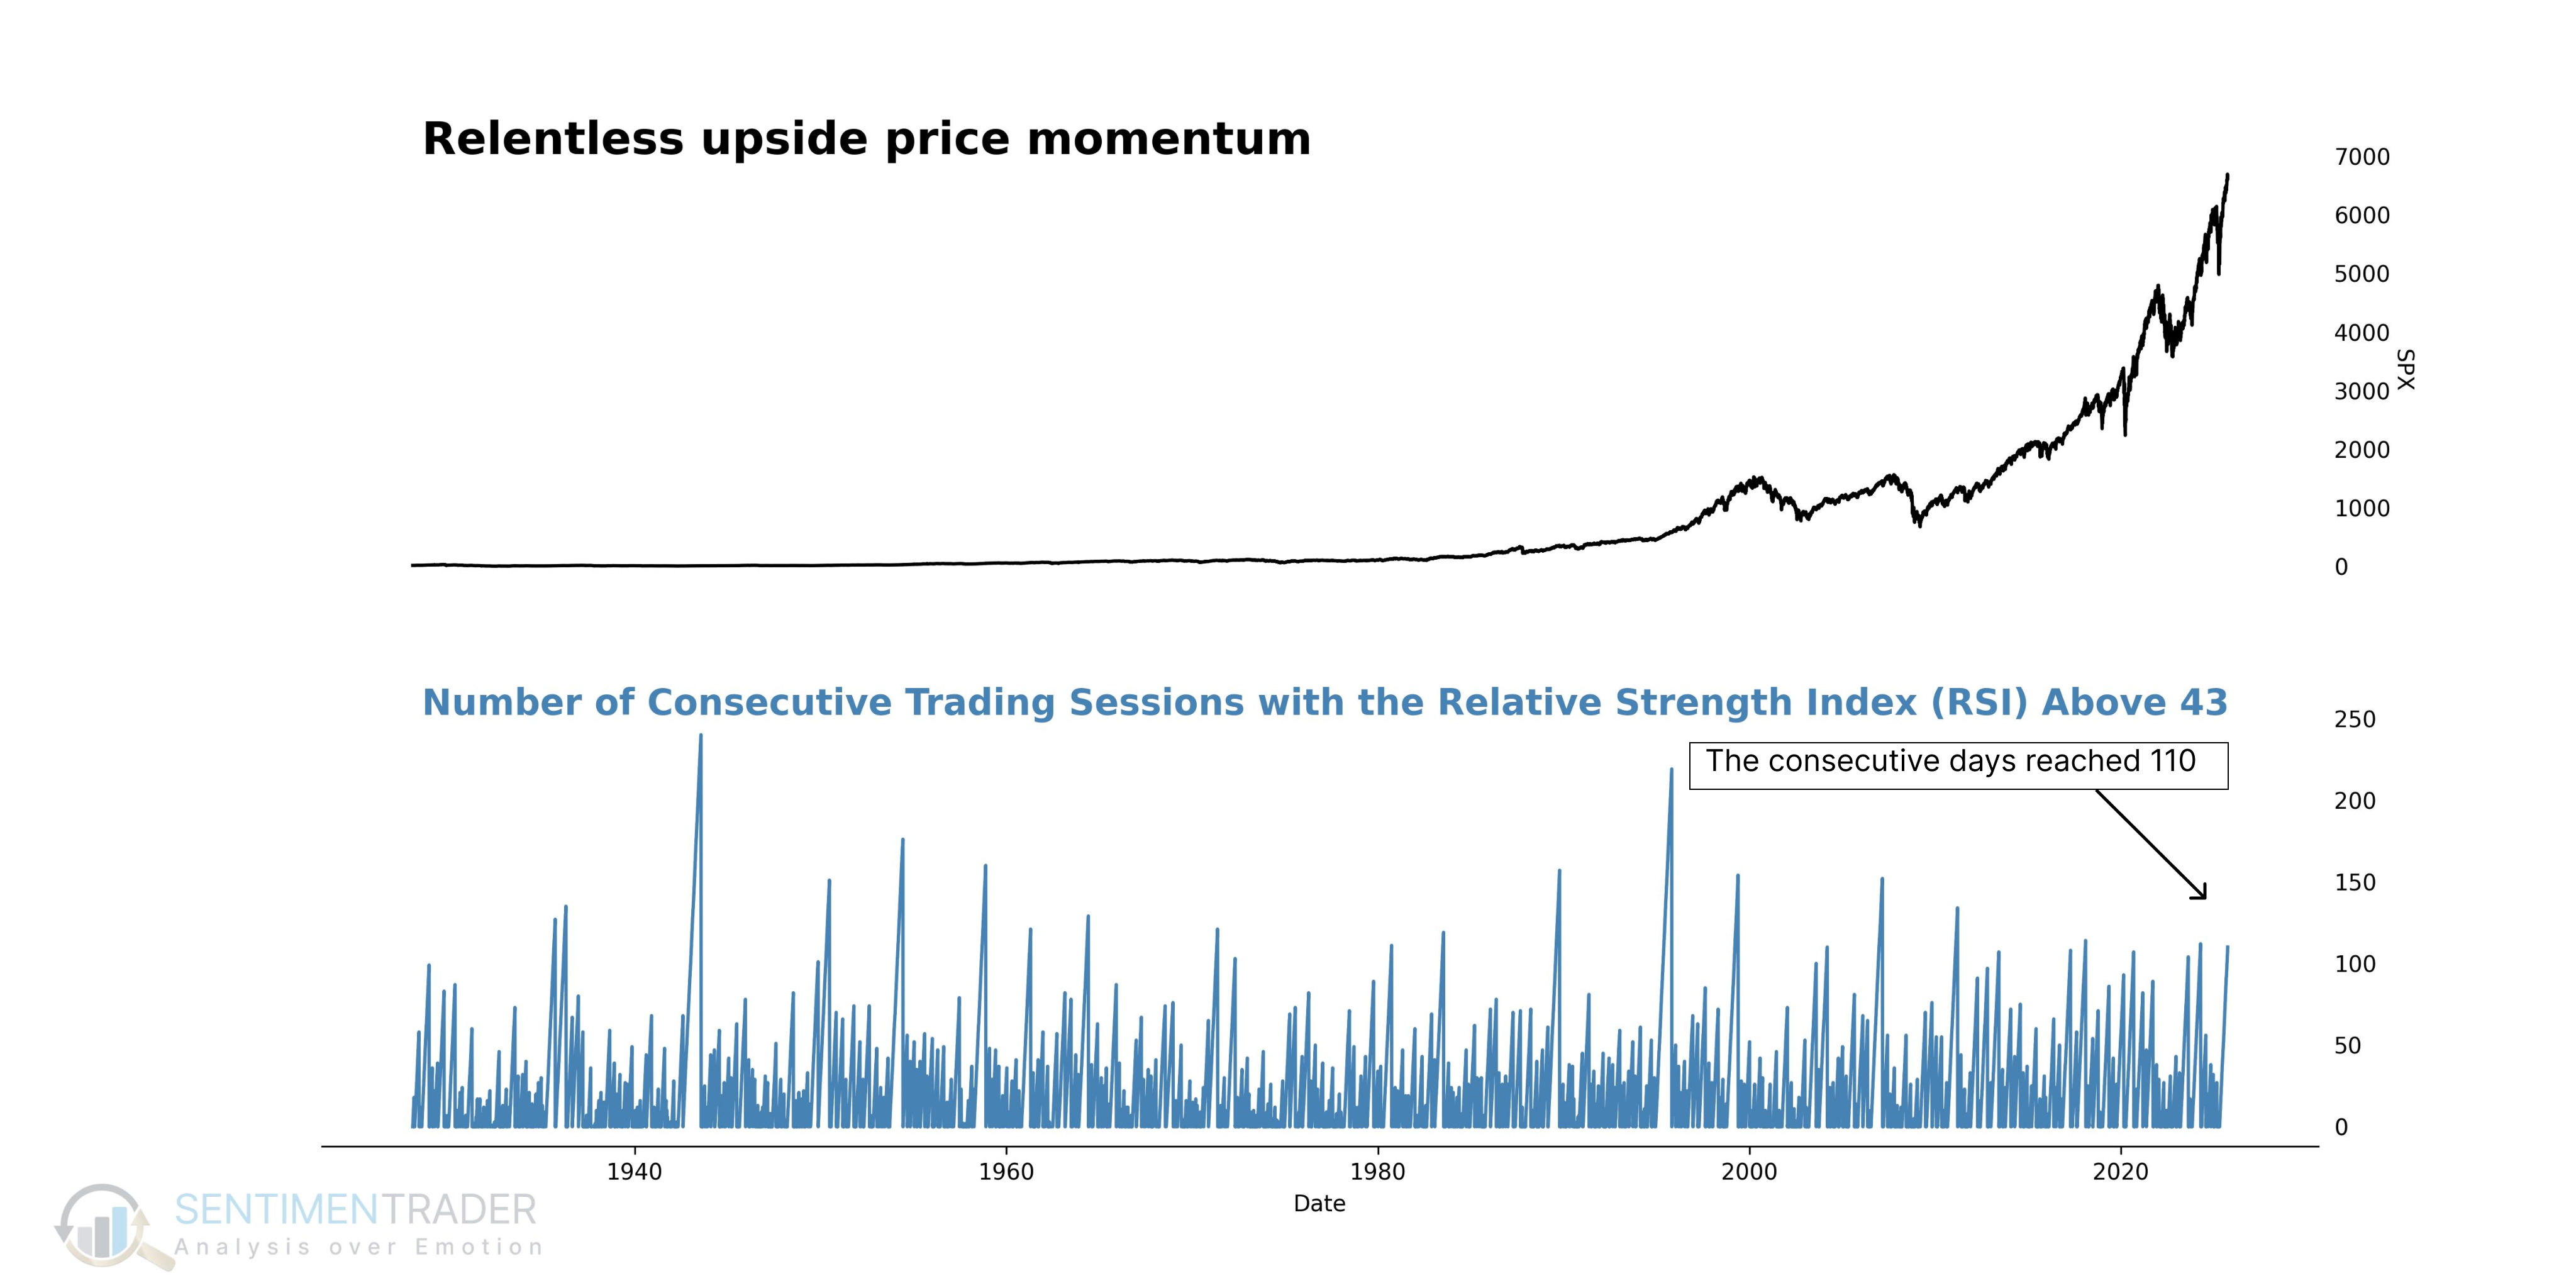
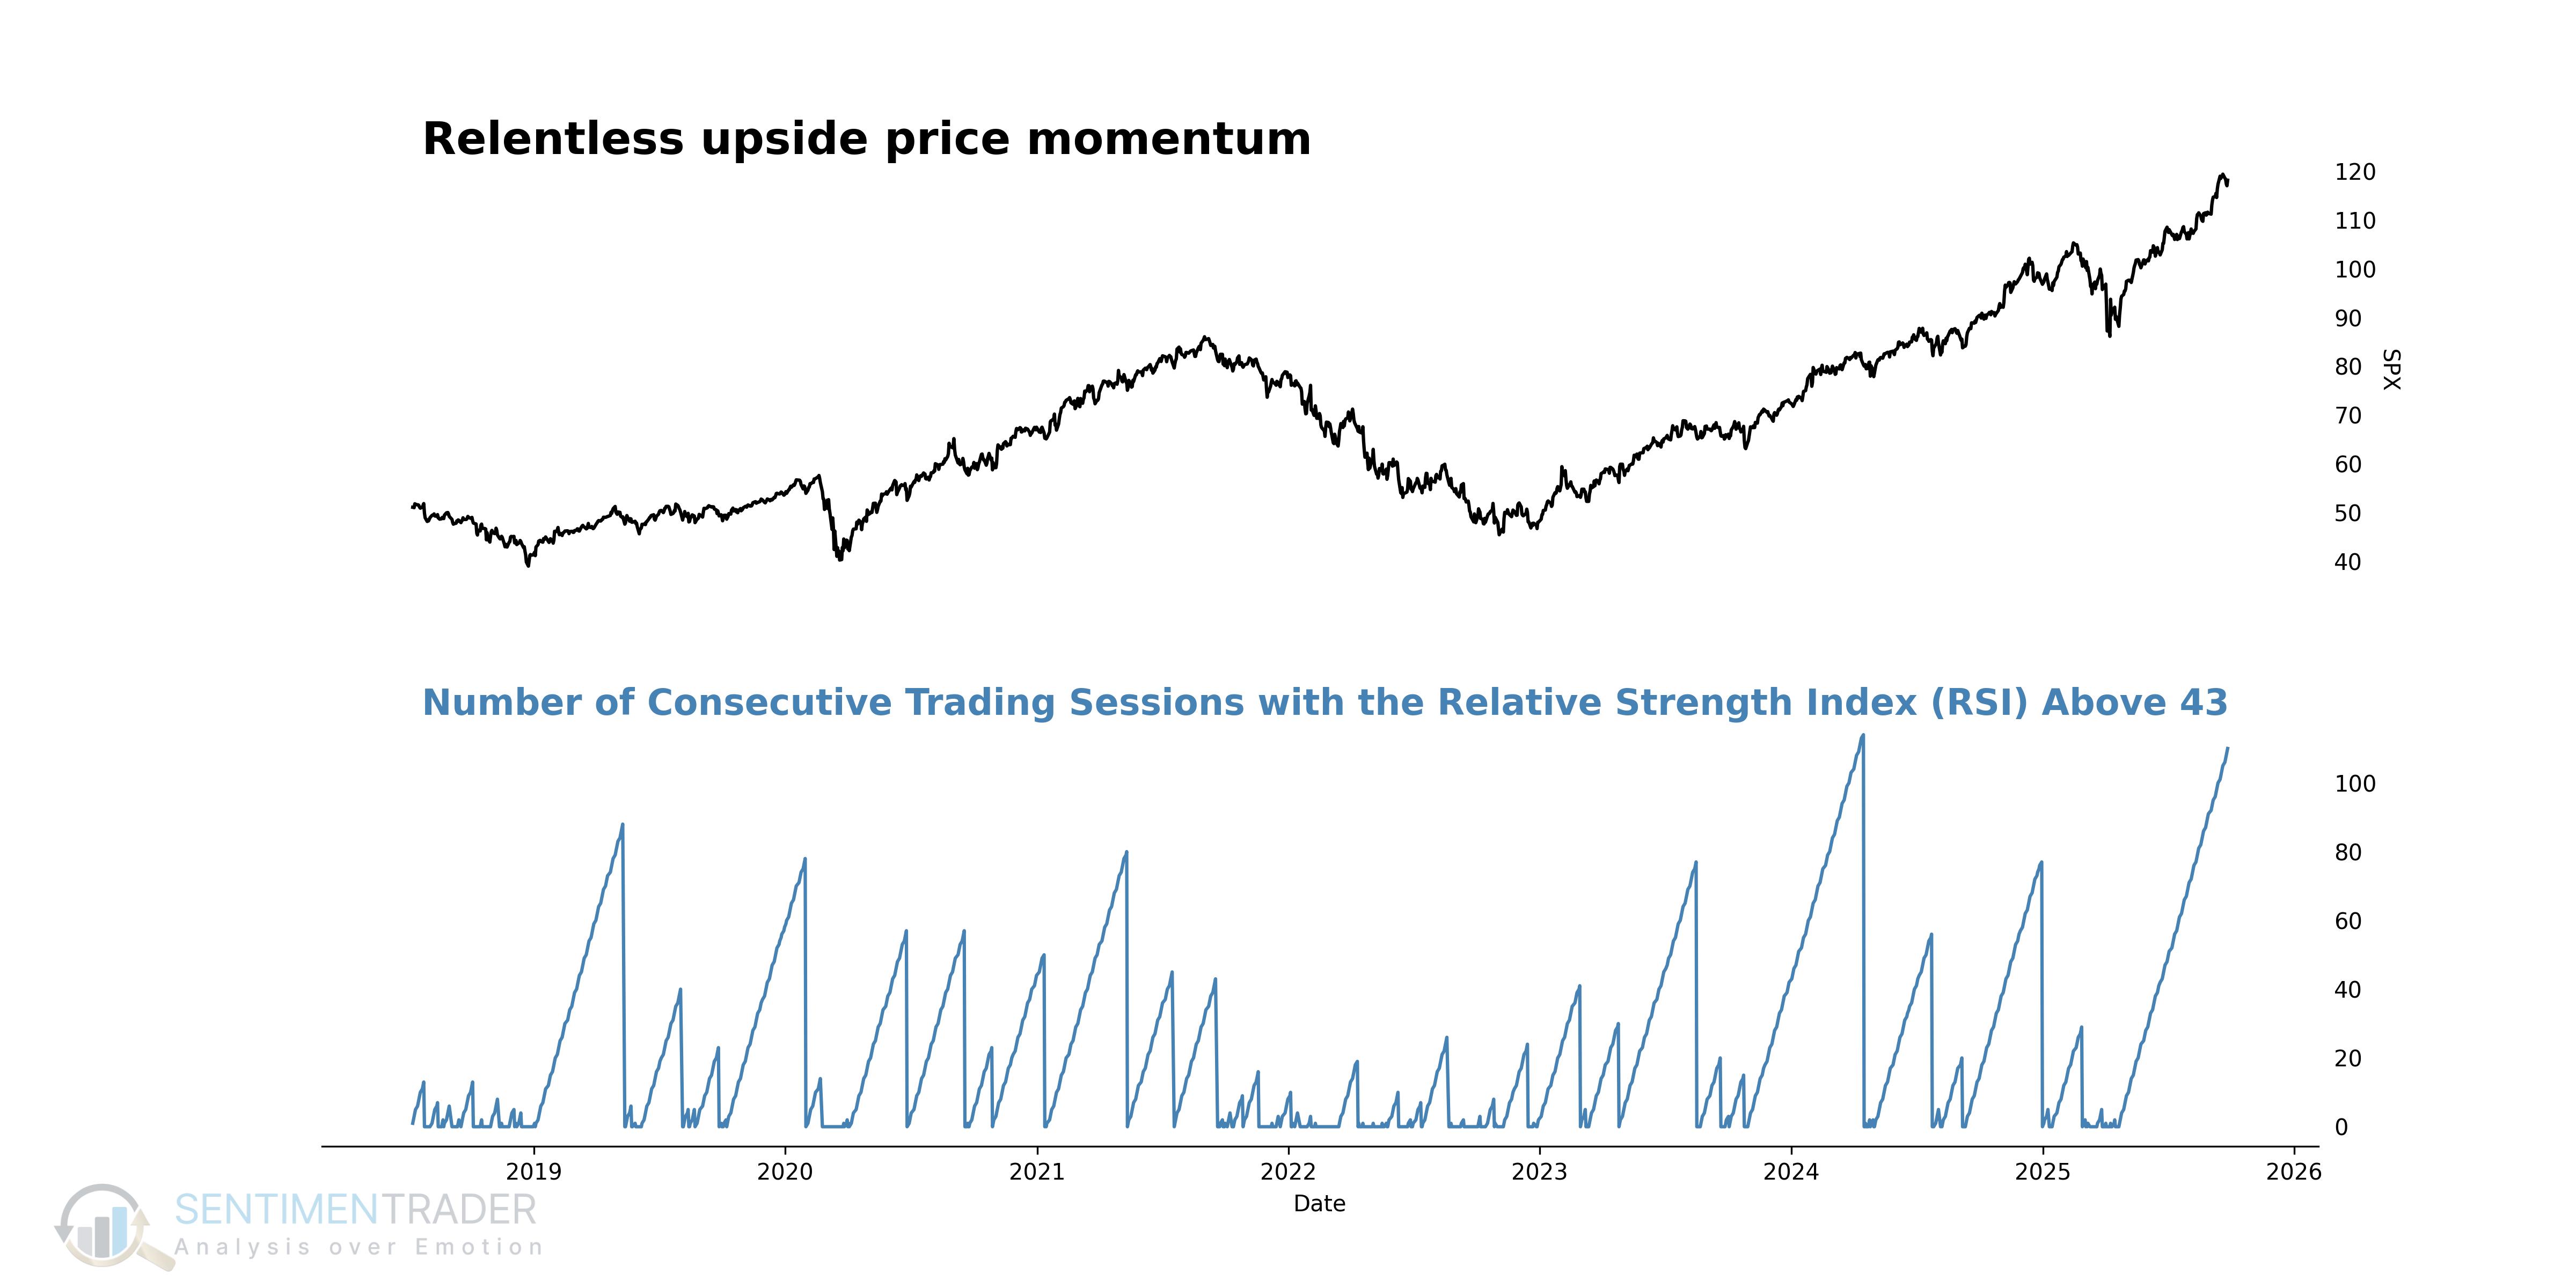
- The S&P 500's Relative Strength Index has remained above a value of 43 for 110 consecutive trading sessions, a rare display of persistent momentum.
- Historically, similar uptrends were followed by an 83% win rate for the S&P 500 over the next year, with data showing remarkably low drawdowns.
- This underlying strength is also present in the key growth sector of Communication Services (XLC) and the cyclical barometer of Industrials (XLI), which have matched the S&P 500's streak.
A study of persistent bullish price momentum
The Relative Strength Index (RSI) is a popular technical indicator that measures price momentum. While many focus on its ability to signal reversals from "oversold" or "overbought" levels, it can also be used to identify the persistence of a trend. When the RSI sustains itself above a neutral or bullish level for an extended period, it is sometimes referred to as a "bull range." This condition reflects a market where buying pressure has been consistently present.
In an environment dominated by ongoing debates about inflation and the future path of Fed policy, this underlying resilience is particularly noteworthy. This is a condition that has recently occurred in the U.S. stock market. The S&P 500's Relative Strength Index (RSI) has maintained a reading above 43 for 110 consecutive trading sessions.
A history of consistent returns and low volatility
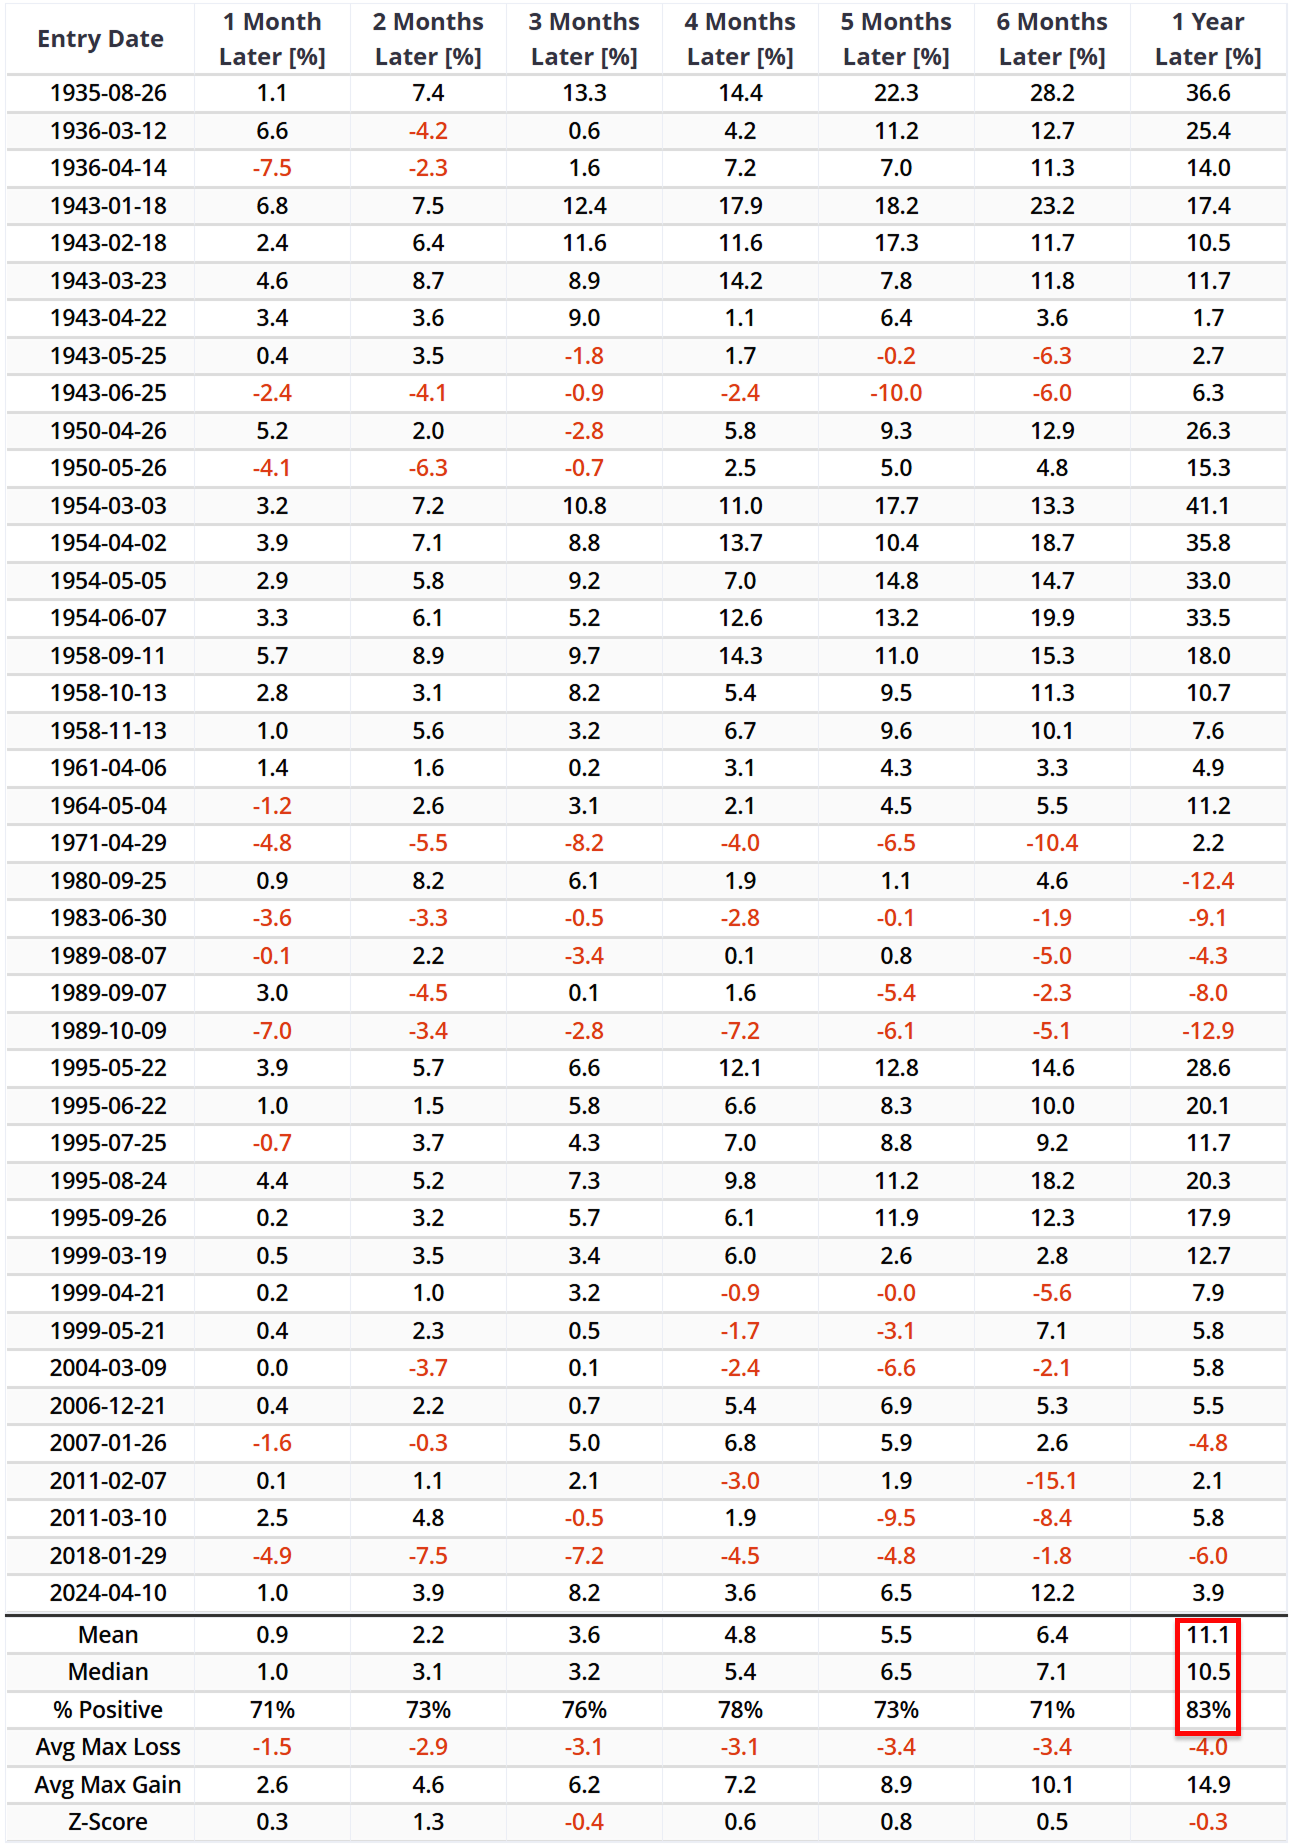
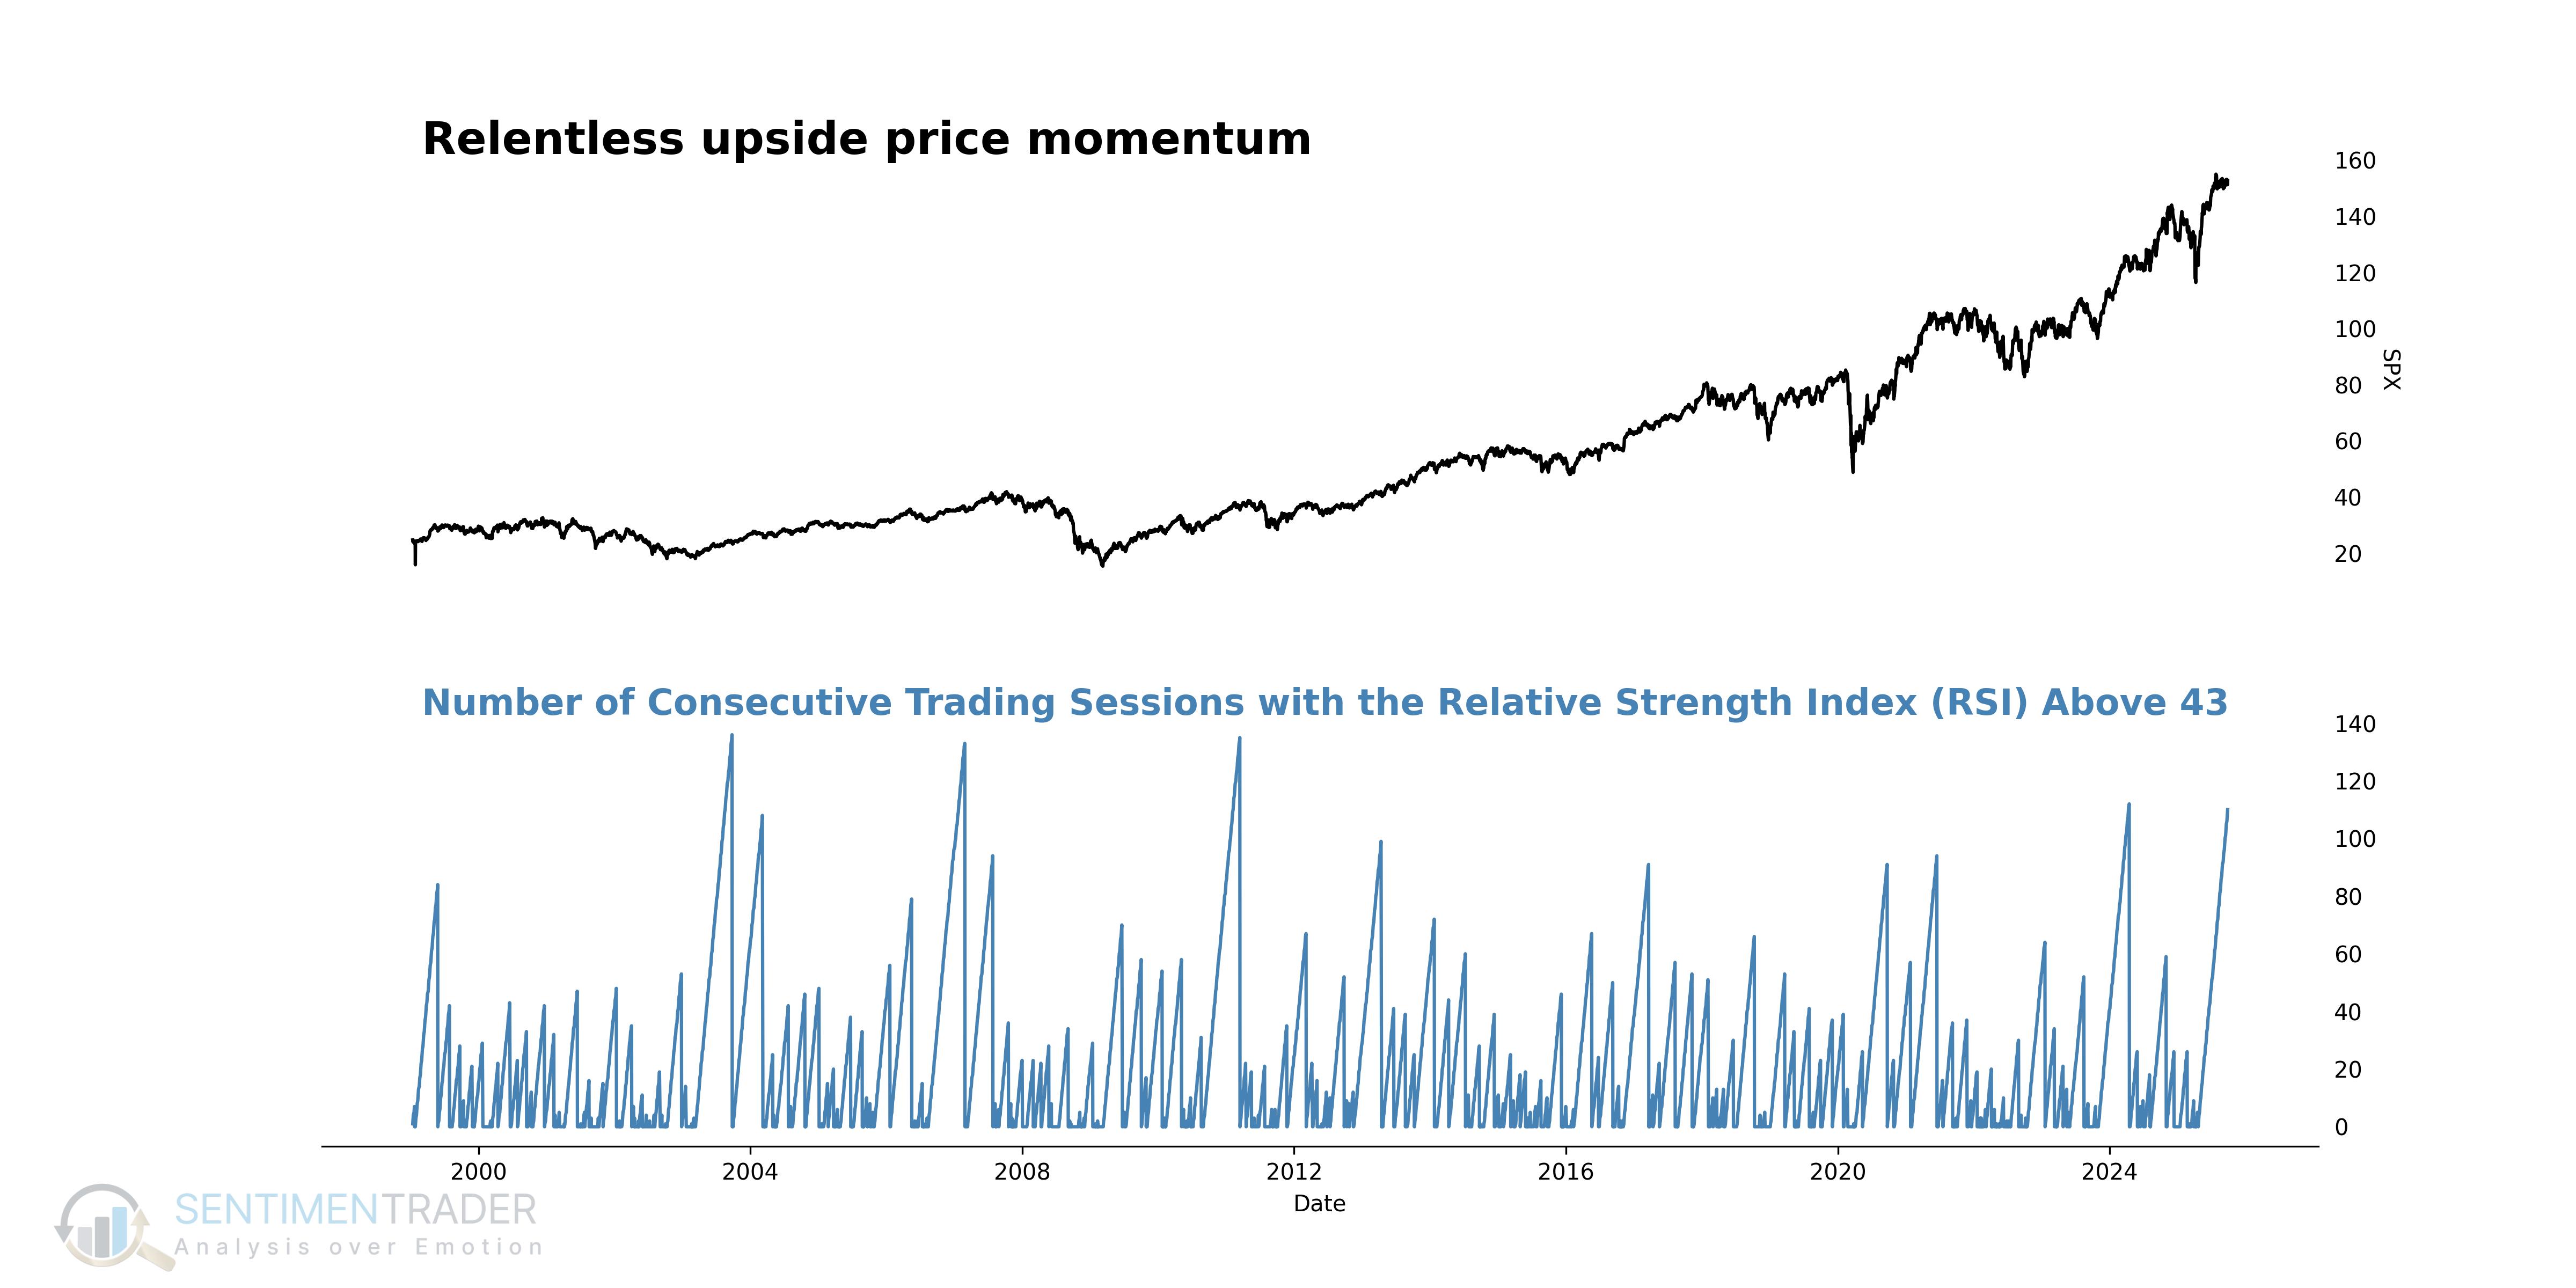
When the S&P 500's RSI has persisted above 43 for at least 110 consecutive trading sessions, the historical performance of the index has been consistently positive and, notably, stable. A look at the historical precedents shows the signal has occurred across different economic regimes, including post-recession recoveries (e.g., 1954), mid-cycle expansions (e.g., 1995), and periods of shifting monetary policy (e.g., 2018). One year after these signals, the S&P 500 showed a positive return 83% of the time, with a mean return of +11.1%.
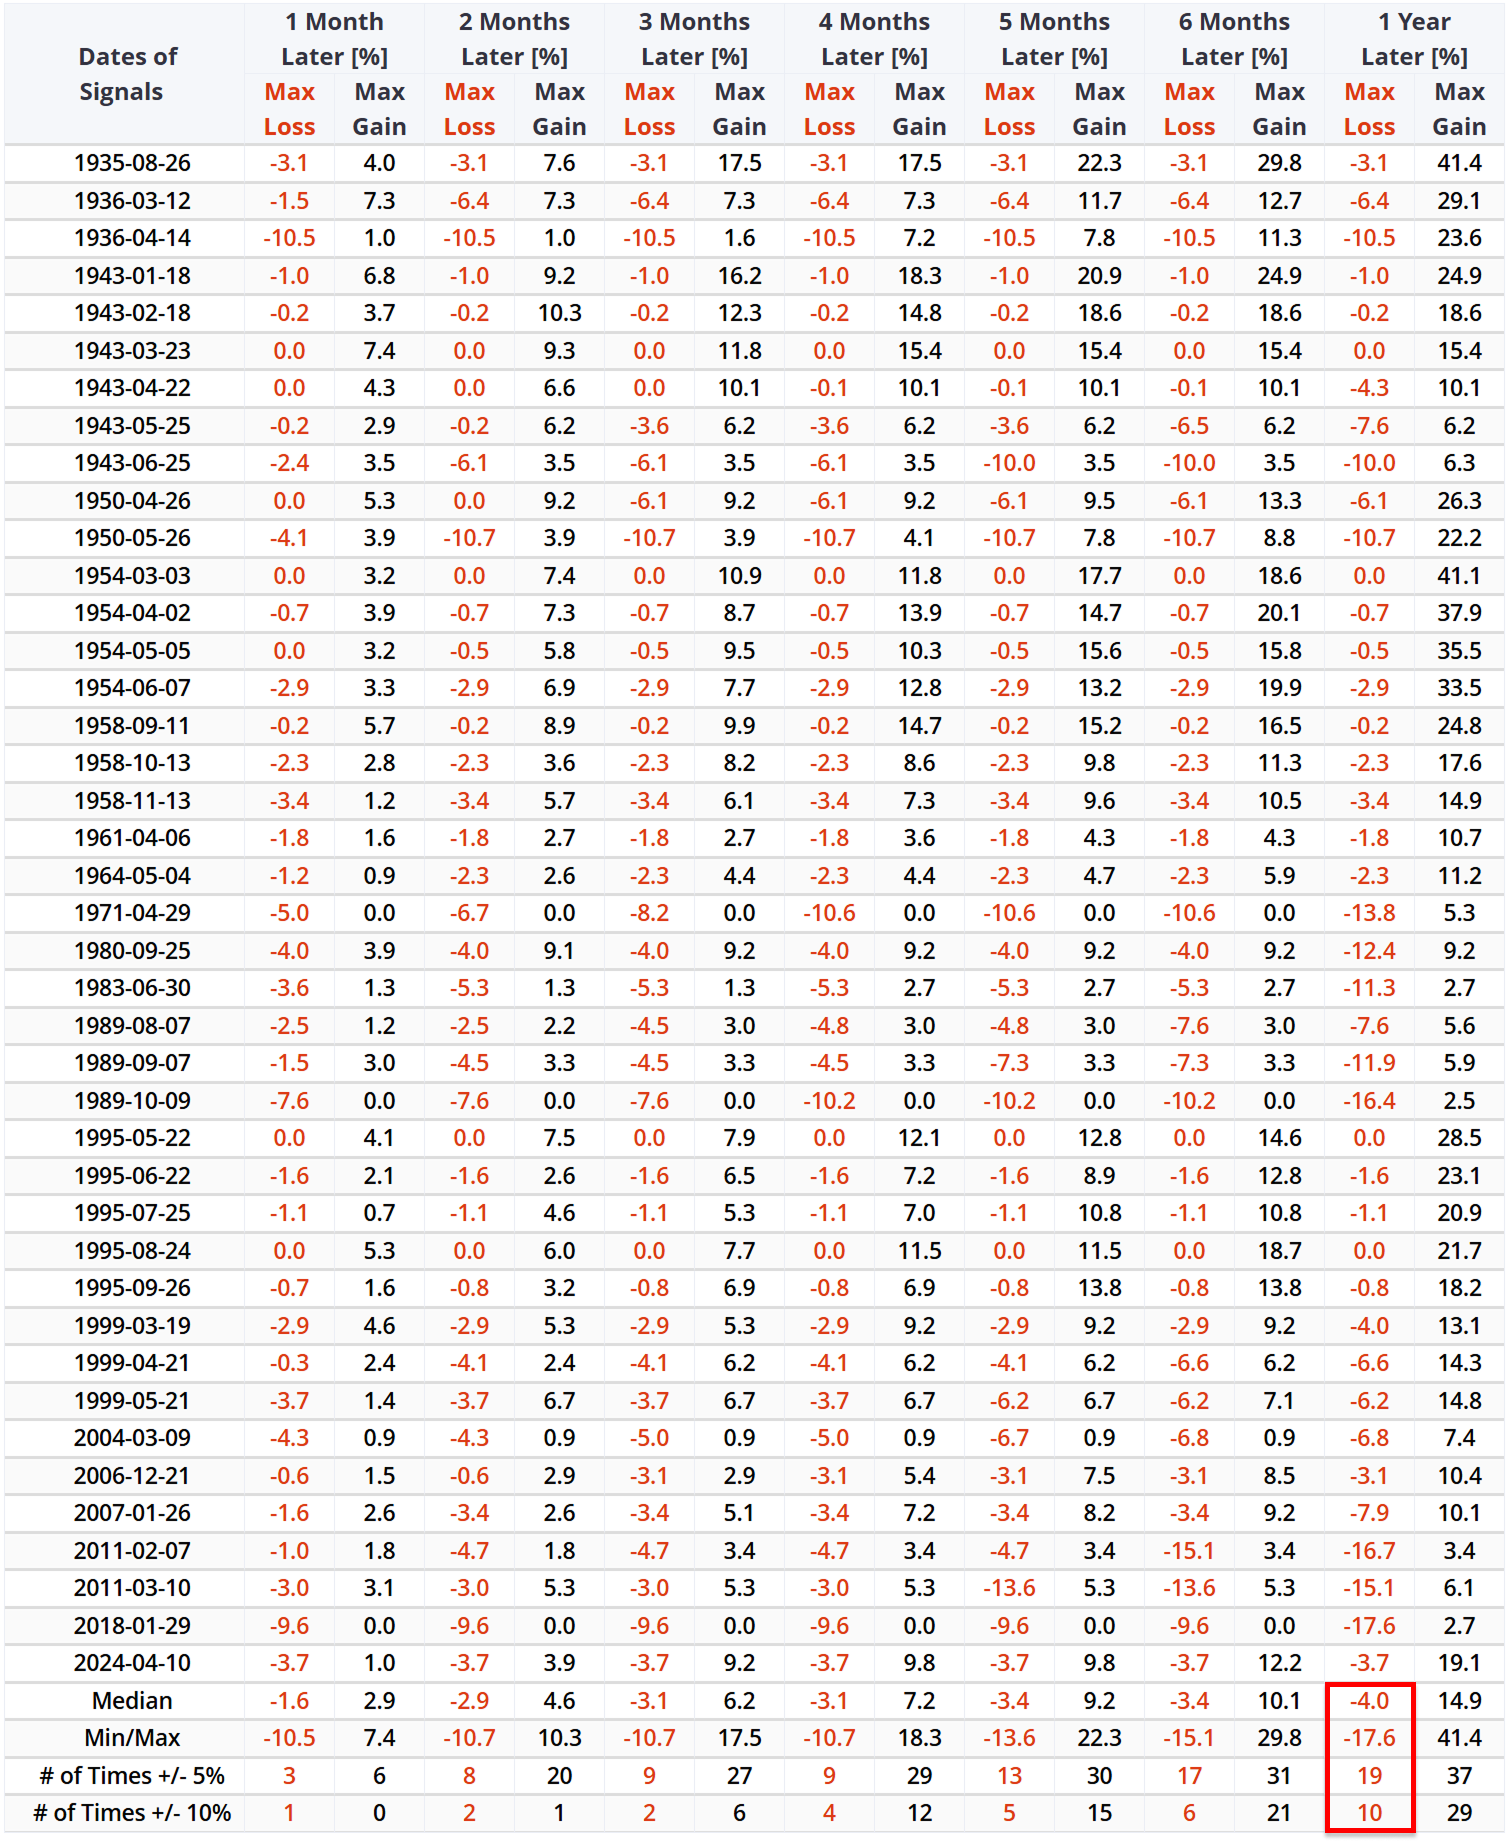
A noteworthy feature in the historical data is the level of volatility that has followed. An analysis of the maximum drawdowns shows a notable level of stability. Over the next twelve months, the median maximum loss was -4.0%. To put that in perspective, a max loss greater than -10% occurred in 10 of the 31 historical instances (~32% of the time). This data shows that the majority of signals were not followed by major drawdowns, and the subsequent uptrends were typically orderly.
Confirmation from market-leading sectors
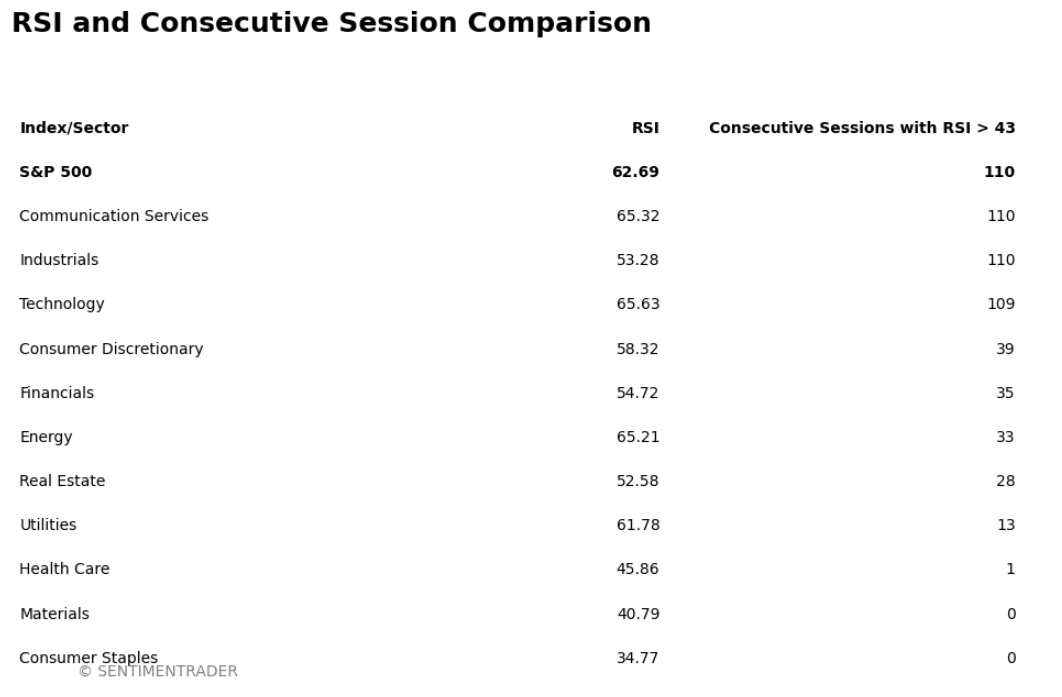
To assess whether this rally has been broad-based, one can look at sector-level data. This data shows that the market's strength has not been isolated; it has also been present in key growth and cyclical sectors, indicating a deeply rooted advance.
As of last week, the streak of consecutive sessions with an RSI above 43 for both the Communication Services and Industrials sectors also reached 110 days, matching the S&P 500. Furthermore, the Technology sector trailed just behind at 109 days.
When a key growth leader like Communication Services (XLC) home to media and internet giants exhibits this level of sustained momentum, it is a data point consistent with strong risk appetite for forward-looking innovation.
Simultaneously, when a core cyclical barometer like Industrials (XLI) a proxy for the real economy shows the exact same strength, it provides an indication that the positive trend has been broad-based and tied to economic fundamentals. The observation of these two distinct pillars of the economy moving in lockstep is a data point that runs contrary to a narrow-market thesis.
What the research tells us...
The S&P 500 has recently displayed a rare and powerful pattern of persistent momentum. Historically, such periods have been followed by consistent, low-volatility gains. The analysis highlights three key data points: a persistent broad market trend, a history of relatively stable advances, and parallel strength in key growth and cyclical sectors.
The fact that the Communication Services and Industrials sectors are showing identical streaks of momentum provides data consistent with a broad and healthy market advance. In summary, the historical data associated with this rare RSI streak, combined with its confirmation across key sectors, presents a precedent that has been followed by positive and stable market performance.