Products
SentimenTrader Trading Tools
‍
Backtest Engine
My Trading Toolkit
Correlation Analysis
Seasonality
Market Prediction
Indicators & Data API
‍
Proprietary Indicators & Charts
Market Data API
Strategies & Scanner
‍
50+ Trading Strategies
Smart Stock Scanner
Smart Option Scanner
Research Reports
‍
Research Solutions
Reports Library
Free Resources
Simple Backtest Calculator
Simple Seasonality Calculator
The Kelly Criterion Calculator
Sentiment Geo Map
Public Research Reports
Education
Sentiment Indicators
Technical Indicators
Pricing
Company
About
In the News
Testimonials
Client Success Stories
Contact
Log inLoginSign up
< BACK TO ALL REPORTS

A short-term warning from an obscure seasonal quirk

Jay Kaeppel
2022-04-22
Seasonality is best used as a signpost to point traders in the right direction (hopefully). When a seasonal trend (what "should" happen) agrees with price action (what "is" happening), the combination can be potent. A little-known seasonal quirk hangs over the market as May and June unfold. If the market fails to regain its bullish footing soon, this particular anomaly may point to a few more challenging couple of months.

Key Points

  • My favorite quote regarding seasonality is from Michael Santoli, who claims that "Seasonality is climate, not weather"
  • i.e., seasonality tells you what has tended to happen during a given period in the past; it does not tell you what is going to happen the next time around
  • The proper way to use seasonality is to help you identify "possibilities" (or, in some cases, "probabilities")
  • Investors might keep a wary eye on price action as an obscure seasonal quirk hangs over the market during the next two months

May and June of 2nd year of Democratic president term

Here is what we will consider:

  • The performance of the Dow Jones Industrial Average during May and June during each year (post-election, mid-term, pre-election, election) of a Democratic president's first term

I warned you this one was obscure.

The chart below shows the cumulative % + (-) achieved by the Dow if held long only during May and June of each year of a Democratic president's first term.

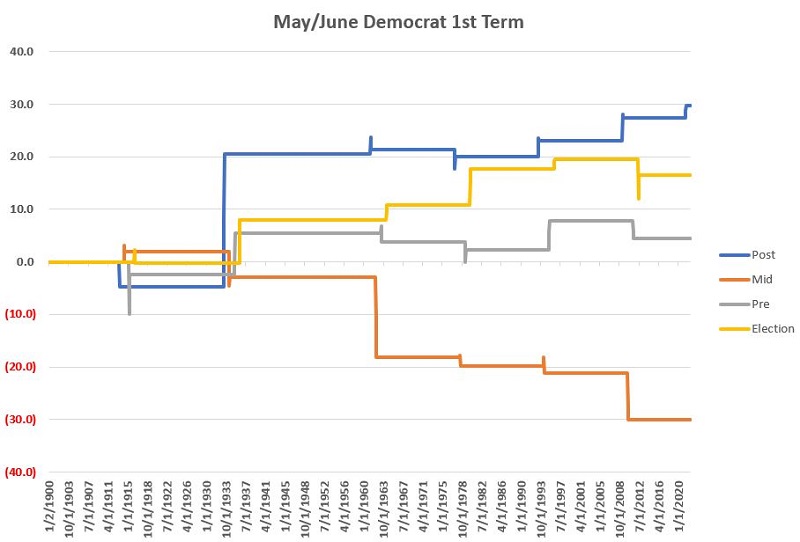
Note that all years showed a May/June gain EXCEPT the mid-term year - which showed a significant cumulative decline.

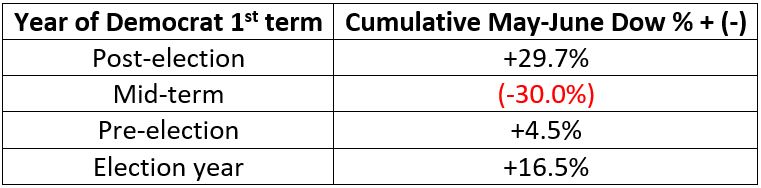
The table below shows a summary of performance.

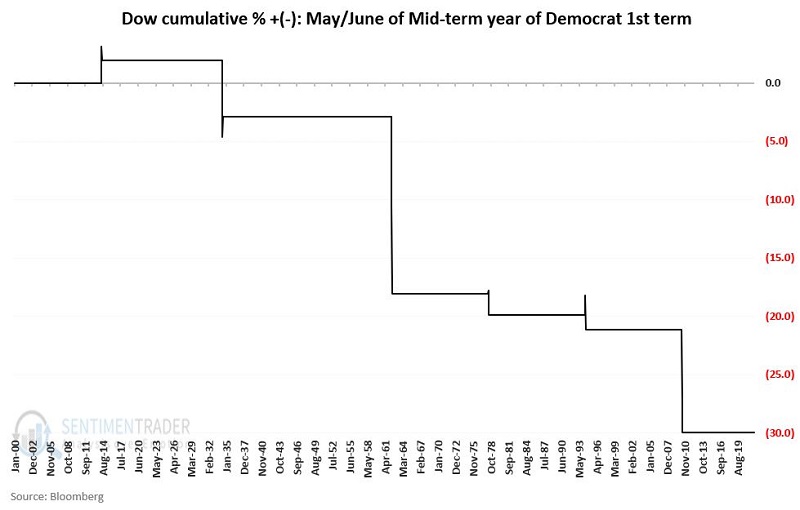
A closer look at Mid-term May/June

The chart below shows the cumulative % + (-) achieved by the Dow if held long only during May and June of the mid-term election year of each Democratic president's first term.

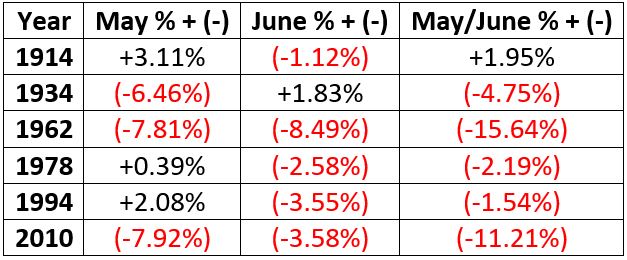
The table below shows a summary of year-by-year performance.

What the research tells us…

Seasonality is a signpost, nothing more, nothing less. The best way to use seasonality is to consider it with other indicators, especially price-based indicators. To put it simply, if seasonality suggests weak price action AND price action is showing weakness, then extreme caution may be in order.

Given the stock market weakness we have seen so far in 2022, this seasonal quirk suggests that things may worsen before they get better. Suppose an investor has been thinking about hedging their stock market positions. This odd quirk indicates that the time to do that may be close at hand, particularly if the major indexes fail to climb back above their respective 200-day moving averages. 

At the same time, this is a tiny sample and size, and the reality is that no investor should rely too heavily on this odd statistical quirk. 

Remember folks, climate not weather.

PRODUCTS
SentimenTrader
Trading Tools
Indicators & Data API
‍
Strategies & Scanner
‍
Research Reports
FREE
RESOUrCES
Simple Backtest
Calculator
Simple Seasonality
Calculator
The Kelly Criterion
Calculator
Sentiment Geo Map
‍
Public Research Reports
‍
Education
Sentiment Indicators
‍
Technical Indicators
‍
Pricing
Bundle pricing
‍
FAQ
‍
Announcements
‍
COMPANY
‍
About
‍
In the News
‍
Testimonials
‍
Client Success Stories
CONTACT
‍
General Inquiries
‍
Media Inquiries
‍
Financial Professionals Inquiries
‍
© 2026 Sundial Capital Research Inc. All rights reserved.
Setsail Marketing
TermsPrivacyAffiliate Program
Risk Disclosure: The information and tools provided are for research and analytical purposes only and are not intended as investment advice. Market analysis involves uncertainty, and outcomes may differ from expectations. Users should conduct their own due diligence and consider their individual circumstances before making any financial decisions. Past performance is not necessarily indicative of future results.

Hypothetical Performance Disclosure: Hypothetical performance results have many inherent limitations, some of which are described below. No representation is being made that any account will or is likely to achieve profits or losses similar to those shown; in fact, there are frequently sharp differences between hypothetical performance results and the actual results subsequently achieved by any particular trading program. One of the limitations of hypothetical performance results is that they are generally prepared with the benefit of hindsight. In addition, hypothetical trading does not involve financial risk, and no hypothetical trading record can completely account for the impact of financial risk of actual trading. for example, the ability to withstand losses or to adhere to a particular trading program in spite of trading losses are material points which can also adversely affect actual trading results. There are numerous other factors related to the markets in general or to the implementation of any specific trading program which cannot be fully accounted for in the preparation of hypothetical performance results and all which can adversely affect trading results.

Testimonial Disclosure: Testimonials appearing on this website may not be representative of other clients or customers and is not a guarantee of future performance or success.