Products
SentimenTrader Trading Tools
‍
Backtest Engine
My Trading Toolkit
Correlation Analysis
Seasonality
Market Prediction
Indicators & Data API
‍
Proprietary Indicators & Charts
Market Data API
Strategies & Scanner
‍
50+ Trading Strategies
Smart Stock Scanner
Smart Option Scanner
Research Reports
‍
Research Solutions
Reports Library
Free Resources
Simple Backtest Calculator
Simple Seasonality Calculator
The Kelly Criterion Calculator
Sentiment Geo Map
Public Research Reports
Education
Sentiment Indicators
Technical Indicators
Pricing
Company
About
In the News
Testimonials
Client Success Stories
Contact
Log inLoginSign up
< BACK TO ALL REPORTS

A short-term trading opportunity in high yield bonds

Jay Kaeppel
2022-12-14
High-yield bonds tend to rally near year-end and into the early part of the new year. This piece looks at historical results and a simple way to take advantage of this little-known phenomenon.

Key points:

  • High-yield bonds are entering a favorable seasonal period
  • The period combines the end of the year with the first few days of the new year
  • ETFs offer investors a simple way to play

The end-of-year seasonal high-yield window

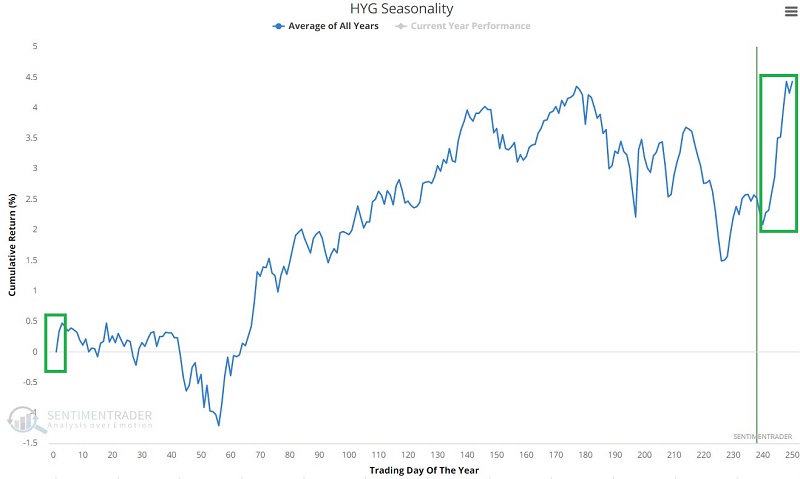
The window that we will consider begins on the close of Trading Day of Year (TDY) #240 and extends through the close on the 3rd trading day of the new year. For 2022, this period begins at the close on December 14th and extends through the close on January 5th of 2023.

The chart below displays the annual seasonal trend for iShares iBoxx $ High Yield Corporate Bond ETF (HYG) and highlights the seasonal window in question.

To create the longest test period possible, we will initially use daily total return data for Vanguard High Yield Corporate Fund (VWEHX), which began trading in 1980. The chart below displays the cumulative growth of $1 invested in VWEHX only from TDY #240 through TDY #3 of the following year each year, starting in 1980.

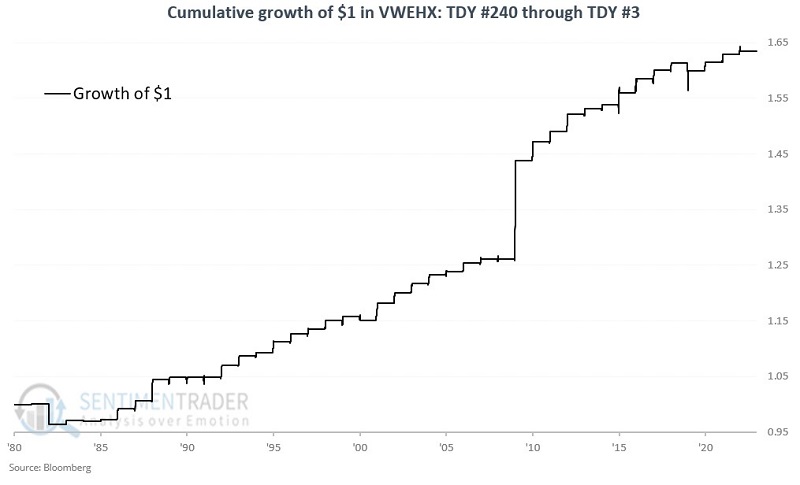
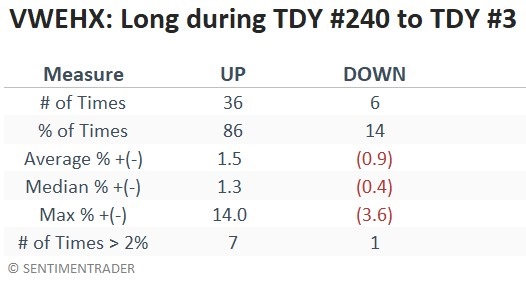
During these windows, the fund gained 36 times and retreated only 6 times. Its average gain wasn't exceptional, but remember this is a bond fund where volatility tends to be lower.

Trading this seasonal window with an ETF

Vanguard has certain switching restrictions, which may make it challenging to trade short-term with VWEHX. So, let's turn our attention to an ETF alternative. iShares iBoxx $ High Yield Corporate Bond ETF (HYG) is a heavily-traded ETF that tracks the iBoxx USD Liquid High Yield Index. HYG began trading in 2007.

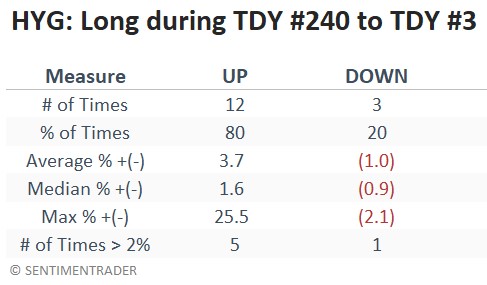
The chart below displays the cumulative growth of $1 invested in HYGX only from TDY #240 through TDY #3 of the following year each year, starting in 2007.

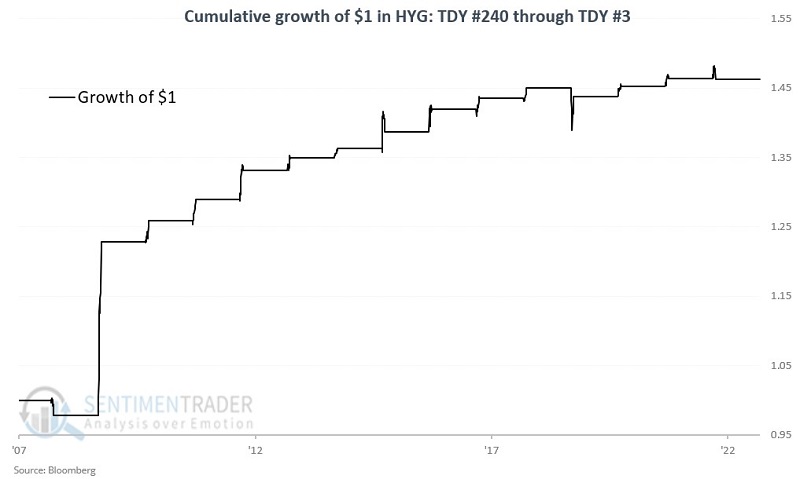
HYG gained 12 times during these windows versus only 3 losses, and its average gain was large relative to its average loss.

What the research tells us…

The good news regarding this seasonal trend is the consistent nature of positive returns and the historical lack of significant downside risk. The bad news is that in many individual years, the results are not eye-popping. Likewise, there is no guarantee that a given seasonal trend will perform as hoped/expected during any given year. 

PRODUCTS
SentimenTrader
Trading Tools
Indicators & Data API
‍
Strategies & Scanner
‍
Research Reports
FREE
RESOUrCES
Simple Backtest
Calculator
Simple Seasonality
Calculator
The Kelly Criterion
Calculator
Sentiment Geo Map
‍
Public Research Reports
‍
Education
Sentiment Indicators
‍
Technical Indicators
‍
Pricing
Bundle pricing
‍
FAQ
‍
Announcements
‍
COMPANY
‍
About
‍
In the News
‍
Testimonials
‍
Client Success Stories
CONTACT
‍
General Inquiries
‍
Media Inquiries
‍
Financial Professionals Inquiries
‍
© 2026 Sundial Capital Research Inc. All rights reserved.
Setsail Marketing
TermsPrivacyAffiliate Program
Risk Disclosure: The information and tools provided are for research and analytical purposes only and are not intended as investment advice. Market analysis involves uncertainty, and outcomes may differ from expectations. Users should conduct their own due diligence and consider their individual circumstances before making any financial decisions. Past performance is not necessarily indicative of future results.

Hypothetical Performance Disclosure: Hypothetical performance results have many inherent limitations, some of which are described below. No representation is being made that any account will or is likely to achieve profits or losses similar to those shown; in fact, there are frequently sharp differences between hypothetical performance results and the actual results subsequently achieved by any particular trading program. One of the limitations of hypothetical performance results is that they are generally prepared with the benefit of hindsight. In addition, hypothetical trading does not involve financial risk, and no hypothetical trading record can completely account for the impact of financial risk of actual trading. for example, the ability to withstand losses or to adhere to a particular trading program in spite of trading losses are material points which can also adversely affect actual trading results. There are numerous other factors related to the markets in general or to the implementation of any specific trading program which cannot be fully accounted for in the preparation of hypothetical performance results and all which can adversely affect trading results.

Testimonial Disclosure: Testimonials appearing on this website may not be representative of other clients or customers and is not a guarantee of future performance or success.