
A short-term traders guide to consumer discretionary

Key points
- The consumer discretionary sector has been a laggard on both an absolute and relative basis
- This sector is entering its most favorable seasonal period of the year, and recent corporate insider activity may offer a boost
- Aggressive traders might consider being alert to a potential short-term trading opportunity (with one important caveat)
Consumer Discretionary has plunged
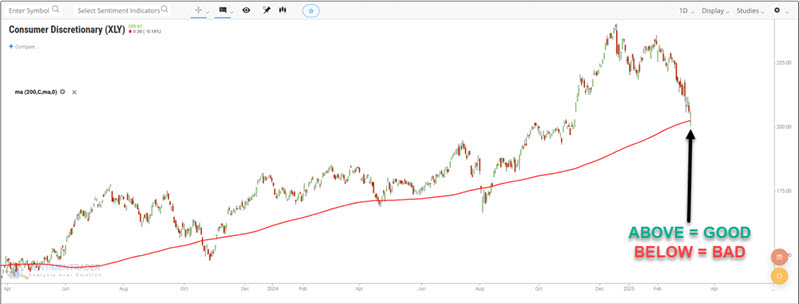
The S&P 500 Consumer Discretionary sector has plunged 12.8% since the end of January and is now testing its 200-day moving average.
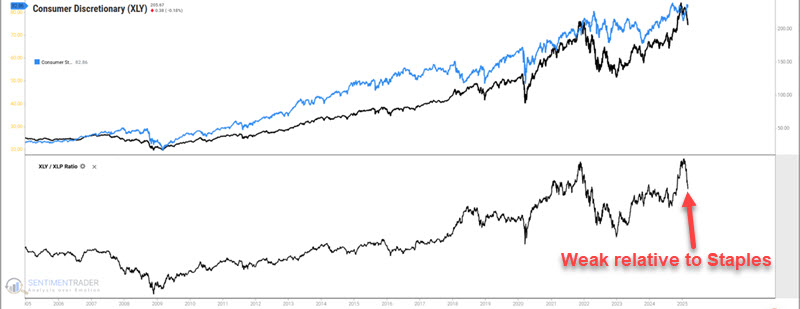
Likewise, it has fallen hard relative to Consumer Staples, which is typically considered an unfavorable omen for the overall stock market.
So, is it time to panic? Not necessarily. Likewise, is it time to avoid the Consumer Discretionary sector altogether? Given the apparent level of absolute and relative weakness shown recently by the bellwether sector, one can make a strong case for steering clear.
But from a contrarian point of view, it is also possible that a surprising rebound is in the process of setting up. Let's look at the factors involved and how to approach this situation from a trader's perspective. Note, however, that a long position in the Consumer Discretionary sector can only be viewed as a speculative venture. Additionally, the "line in the sand" is the 200-day moving average. If the Consumer Discretionary Select Sector SPDR Fund (ticker XLY) is above its 200-day moving average, a long position may be viable. Below the 200-day moving average, however, traders should remain patient before committing.
Seasonality is about to turn favorable
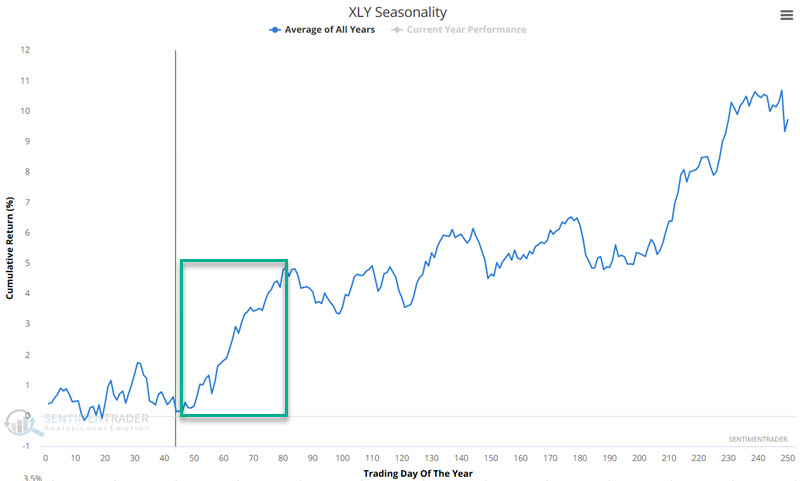
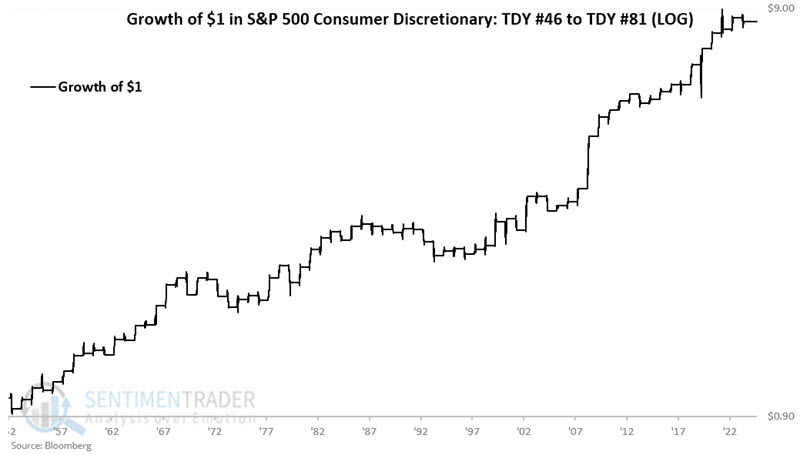
The chart below displays the annual seasonal trend for the S&P 500 Consumer Discretionary sector. The Trading Day of Year #46 through TDY #81 period tends to show price strength. For 2025, this period extends from the close on 2025-03-11 through the close on 2025-04-30.
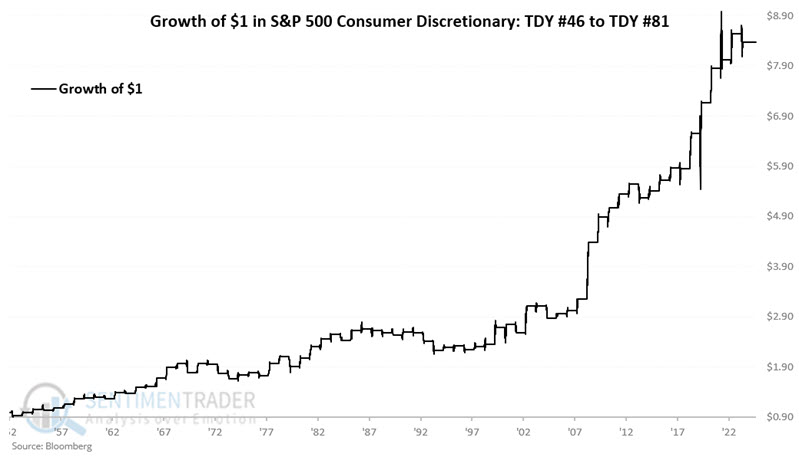
The chart below displays the hypothetical growth of $1 invested in the S&P 500 Consumer Discretionary sector only during the TDY #46 to TDY #81 period every year since 1953.
The chart below displays the same info on a logarithmic scale.
The table below summarizes performance.
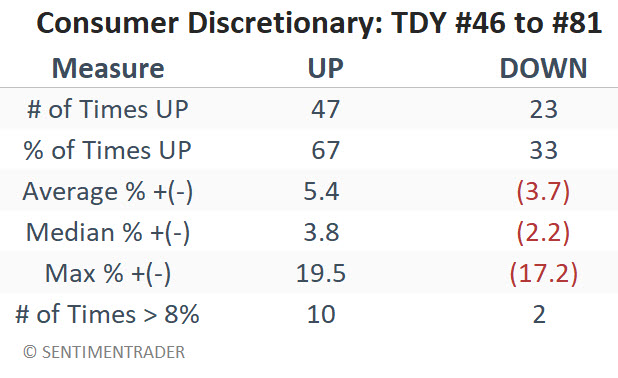
The 67% Win Rate reminds us this is no "sure thing." However, the fact that 8%+ moves skew positive by a ratio of 10-to-2 reminds us of the potential for significant - and relatively quick - profits, particularly if this sector comes off an oversold condition.
Did we see a "tell" from corporate insiders
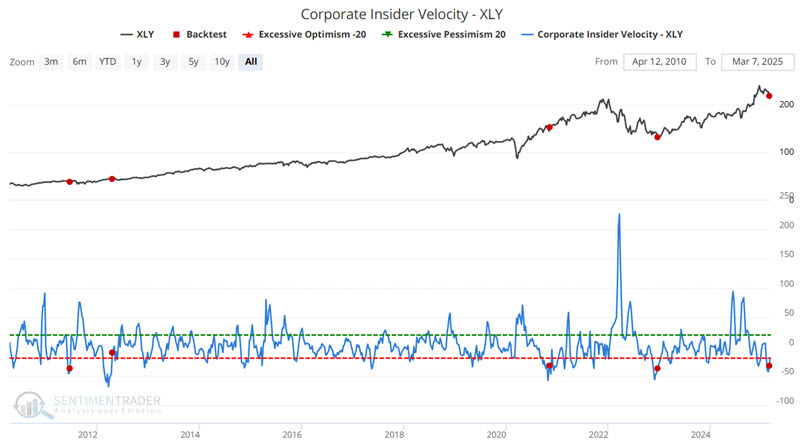
For some time, corporate insider buying in the discretionary sector has been relatively muted. However, our Corporate Insider Velocity - XLY indicator (which takes the 4-week rate of change for insider buys and subtracts a 4-week rate of change for insider sales) recently crossed a noteworthy level.
The chart below highlights the rare occasions when the Corporate Insider Velocity-XLY indicator crossed above -40 for the first time in three months (to eliminate several overlapping signals).
The table below summarizes the results following previous signals.
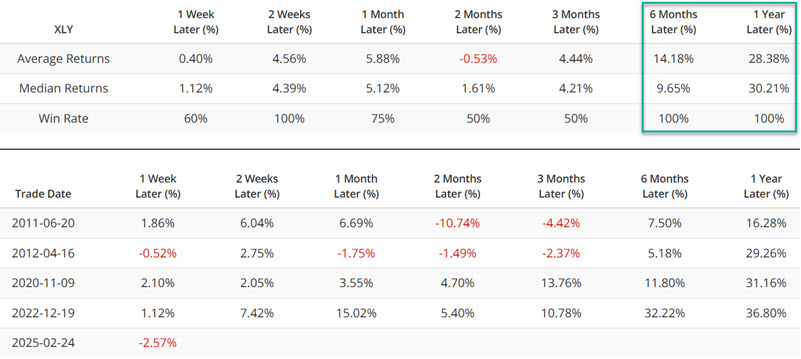
While the sample size is admittedly tiny, the six-month and especially the one-year results have been noteworthy (12-month 100% Win Rate and median return of just over 30%).
What the research tells us…
Are the results detailed above enough to propel discretionary stocks higher? It's hard to say. The point of this analysis is not so much to predict that this sector will rally in the immediate future (in fact, please note that Jason points out in this piece that another indicator suggests the next month could be challenging for XLY) but that traders should now be highly alert to the potential - and to be prepared to take advantage of a potential reversal. Fortunately, traders have a handy "line in the sand" to refer to. A speculative long position is reasonable as long as XLY holds above its 200-day moving average during the impending seasonally favorable period. However, if XLY is trading below its 200-day moving average, then caution remains in order.