
A Short-Term Favorable Period for Stocks Approaches

Key points
- The stock market has a long-term tendency to show strength during the fourth quarter
- In general, the month-end/beginning of a new month period also tends to show strength
- A particular upcoming period near the end of October has shown well above average persistence and strength
A favorable seven trading day period for stocks approaches
The stock market has a long-term tendency to show strength during the fourth quarter. The month-end/beginning of a new month period also tends to show strength. This is especially true during the end of October/beginning of November period.
Specifically, let's consider a period encompassing the last four trading days of October and the first three trading days of November. For 2025, this period begins at the close on Monday, October 27th, and extends through the close on Wednesday, November 5th.
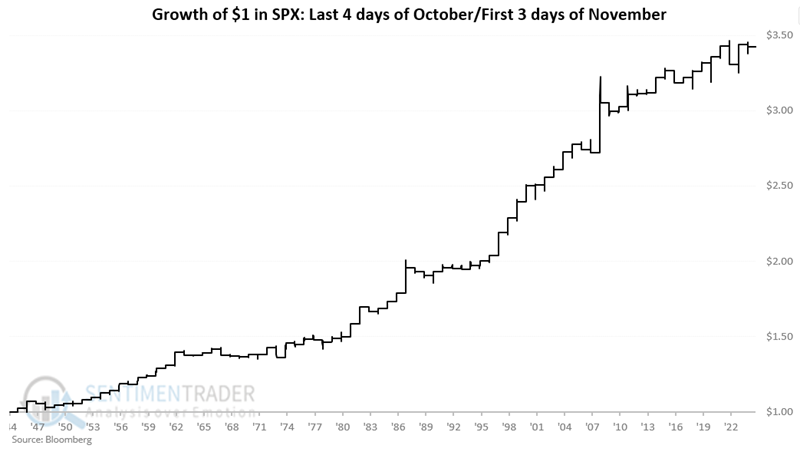
The chart below displays the hypothetical growth of $1 invested in the S&P 500 Index only during this seven-trading-day period every year starting in October 1945.
The table below summarizes S&P 500 performance during this period.
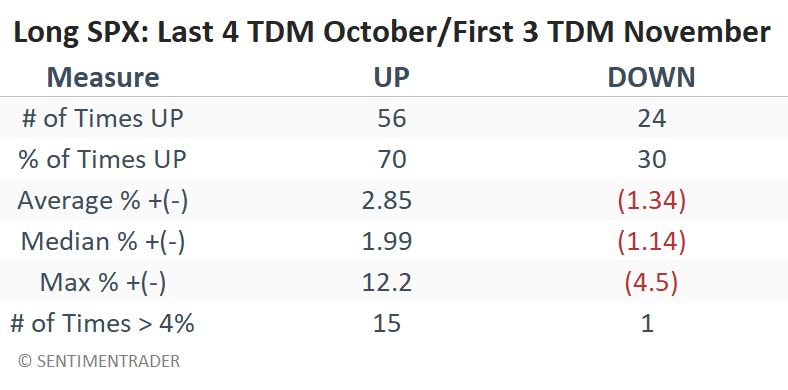
There are several things to like about these results:
- The 70% Win Rate
- The Average Win is 2.13 times the Average Loss
- Median Win is 1.75 times the Median Loss
- A maximum loss of a manageable -4.5%
- Moves in excess of 4% skewed 15-to-1 to the positive side
A 70% Win Rate still reminds us that 30% of the time, a long position in the S&P 500 index during this period resulted in a loss. However, an average loss of -1.34% and a maximum loss of -4.5% are within the manageable range for most traders.
Still, to properly assess these returns, let's compare them to the average returns for all seven trading day periods since 1945.
Comparing results to the seven-trading-day baseline
If we combine the winning and losing end of October/beginning of November periods above, we get:
- A 70% Win Rate
- An average return (across all 80 years) of 1.60%
- A median return (across all 80 years) of 1.40%
The table below compares these numbers for the last four days of October and the first three days of November since 1945 to the results for all seven-day trading periods since January 1st, 1945.
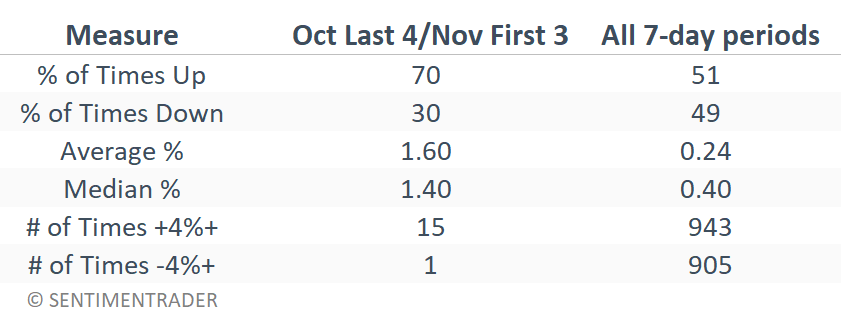
- Note a Win Rate of 70% (versus 51% for all 7-day periods)
- An average return of 1.60% (versus 0.24% for all 7-day periods)
- A median return of 1.40% (versus 0.40% for all 7-day periods)
Also, if we look at 7-day moves of 4% or more, for "All Periods," the S&P 500 gained 4% or more 943 times and lost 4% or more 905 times (about 51% up, 49% down). During the October/November period, moves of 4%+ were gains 94% of the time.
What the research tells us…
The good news is that the last four days of October/first three days of November have demonstrated a clear tendency to a) show a gain for the S&P 500 index, b) perform in an above-average manner relative to all seven-day trading periods in the last 80 years, and c) experience minimal downside risk. The characteristics may be very appealing to short-term stock index traders. The bad news is that there is no guarantee that this period will show a gain "this time around." Likewise, despite the relatively shallow nature of losses during this period previously, a trader is never relieved of the responsibility to allocate capital intelligently and manage risk ruthlessly.