Products
SentimenTrader Trading Tools
‍
Backtest Engine
My Trading Toolkit
Correlation Analysis
Seasonality
Market Prediction
Indicators & Data API
‍
Proprietary Indicators & Charts
Market Data API
Strategies & Scanner
‍
50+ Trading Strategies
Smart Stock Scanner
Smart Option Scanner
Research Reports
‍
Research Solutions
Reports Library
Free Resources
Simple Backtest Calculator
Simple Seasonality Calculator
The Kelly Criterion Calculator
Sentiment Geo Map
Public Research Reports
Education
Sentiment Indicators
Technical Indicators
Pricing
Company
About
In the News
Testimonials
Client Success Stories
Contact
Log inLoginSign up
< BACK TO ALL REPORTS

A short-term caution sign for stocks

Dean Christians
2023-03-20
A trading system that monitors the relative relationship between the equal and cap-weighted S&P 500 index triggered a rotation signal in favor of the cap-weighted S&P 500 index. After similar alerts, the cap and equal-weighted S&P 500 index struggled over the next month. The near-term caution sign for stocks benefited defensive sectors.

Key points:

  • A  relative ratio system for the equal vs. cap-weighted S&P 500 rotates to the cap-weighted S&P 500  
  • After similar signals, the cap and equal-weighted S&P 500 index struggled over the next month
  • Defensive sectors tend to outperform other groups with a more offensive tilt

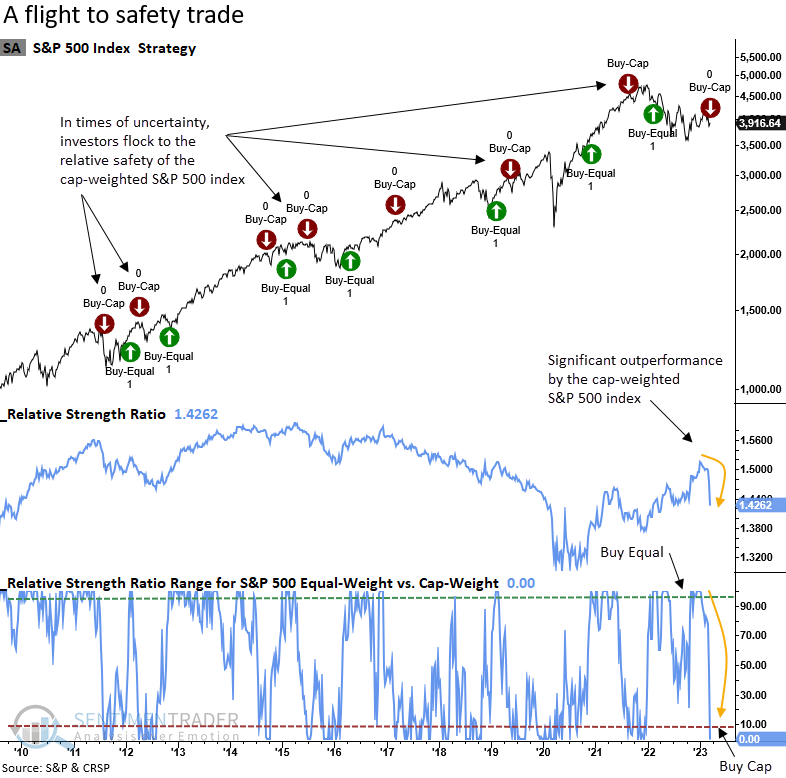
The relative ratio between S&P 500 equal and cap-weighted indexes suggests caution

Investors are crowding into traditional safe-haven assets like Treasury bonds and gold as the turmoil in the banking sector brings back memories of the global financial crisis. 

In times of uncertainty, equity investors play it safe by allocating money to the relative safety of the cap-weighted S&P 500, as its index-weighting methodology tends to favor large companies with higher-quality balance sheets. 

On Friday, a trading system that applies a 26-week range rank to the relative ratio between the equal and cap-weighted S&P 500 index triggered a rotation signal in favor of the cap-weighted S&P 500 index. 

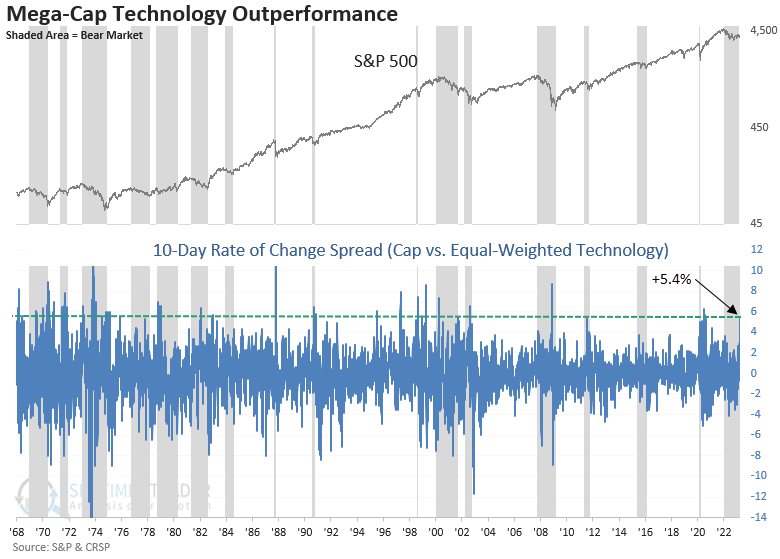
What influenced the reversal in the S&P 500 equal versus cap-weighted ratio 

Over the last ten sessions, the cap-weighted S&P 500 Technology sector outperformed the equal-weighted version by 5.4%, representing the most significant spread since June 2020. Investors decided they would rather own a strong balance sheet name like Microsoft versus something else.

Interestingly, during drawdown periods, the flight to safety trade in Technology is more common than expected.

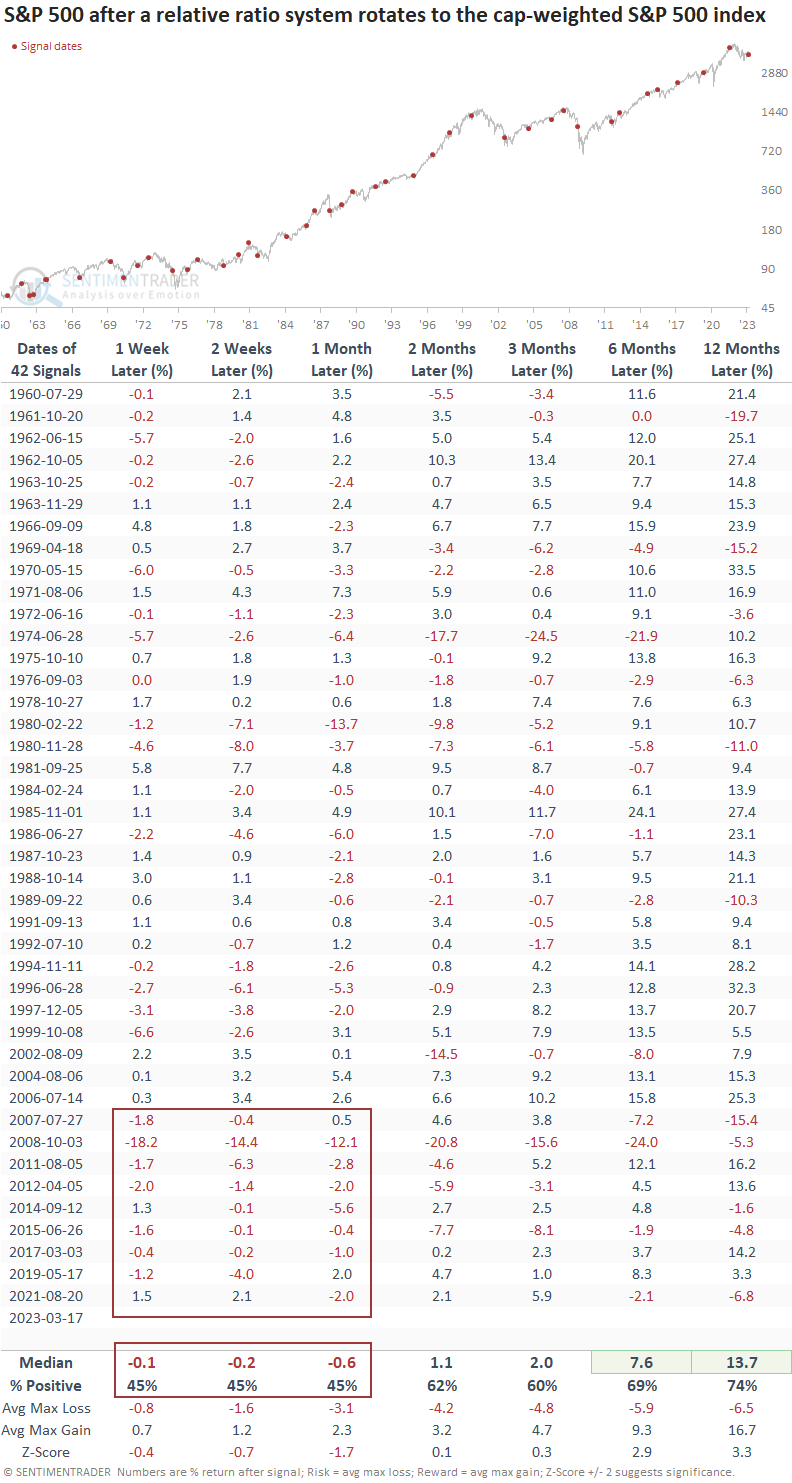
Similar rotations to the cap-weighted S&P 500 suggests short-term caution

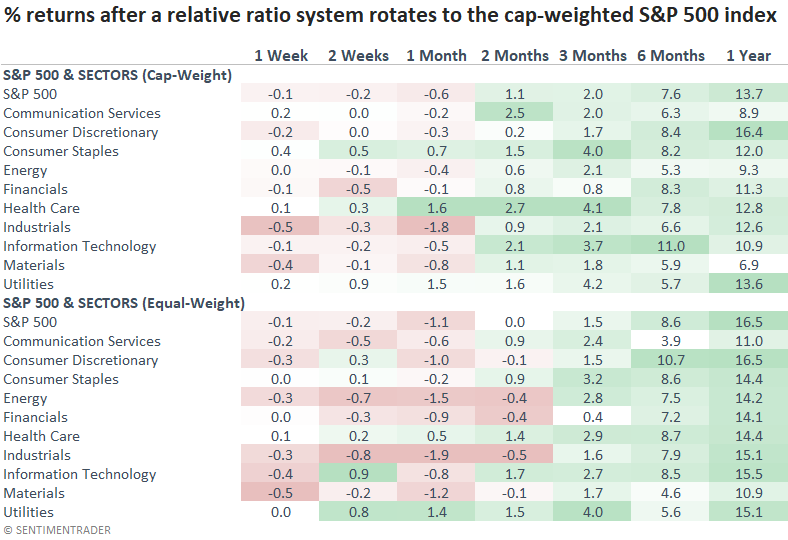
When the relative ratio between the equal and cap-weighted S&P 500 rotates in favor of holding the cap-weighted index, the S&P 500 index tends to struggle over the next month. Since 2007, signals have shown a loss in every single case at some point over that time frame. 

Except for a few bear market instances, the long-term results look solid.

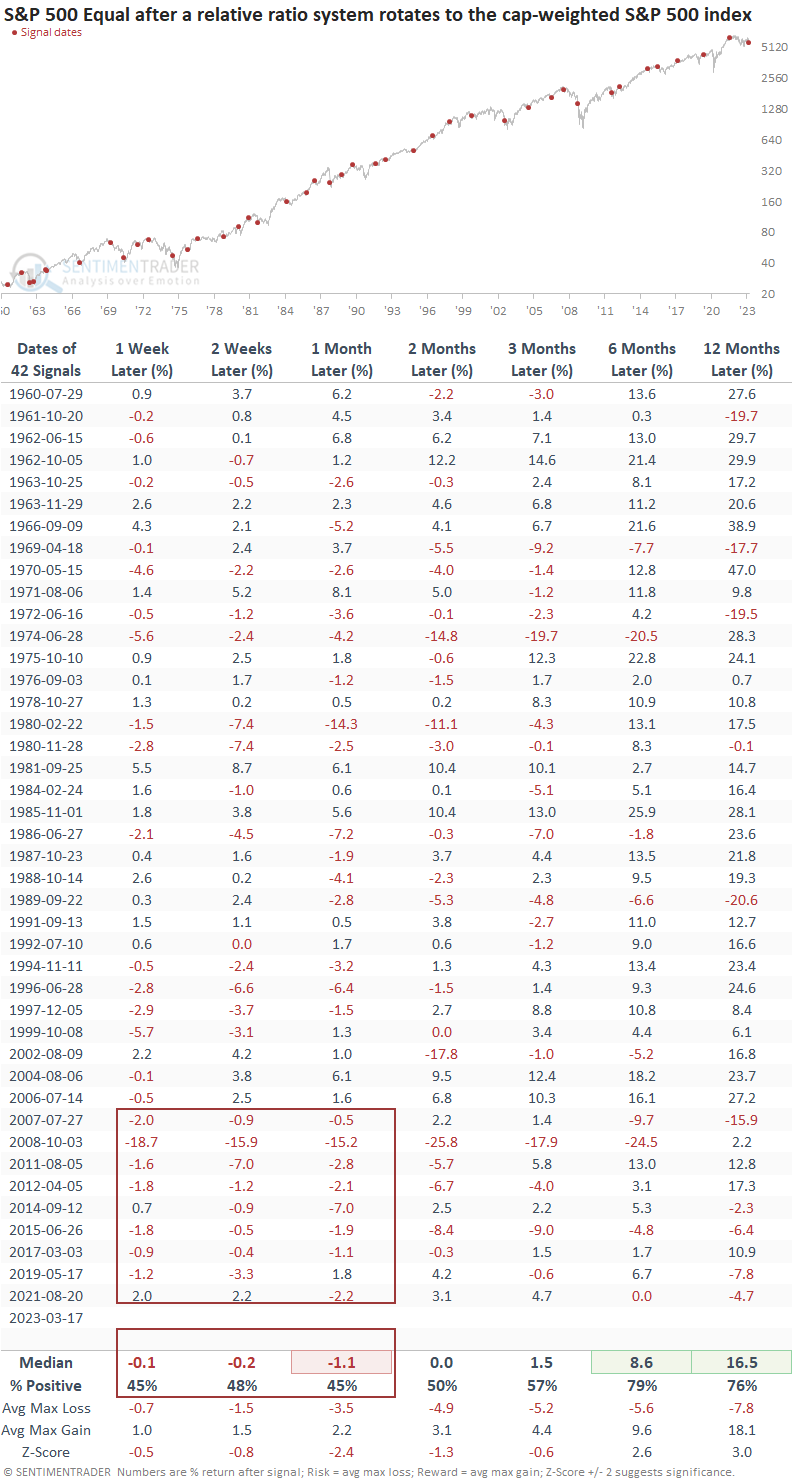
The S&P 500 equal-weighted index shows slightly weaker results than the cap-weighted version over the next few months. From a long-term perspective, one would be better off holding the equal-weighted index based on the return and win rate profiles. 

Not surprisingly, defensive sectors tend to outperform groups with a more offensive tilt over the next few months.

What the research tells us...

Investors crowded into the relative safety of the cap-weighted S&P 500 over the last few weeks as stress in the banking industry stirred up memories of the global financial crisis. A switching system that monitors the relative relationship between the equal and cap-weighted S&P 500 rotated in favor of the cap-weighted S&P 500 index. After similar signals, the cap and equal-weighted index struggled over the next month. The near-term caution sign benefited defensive sectors. 

PRODUCTS
SentimenTrader
Trading Tools
Indicators & Data API
‍
Strategies & Scanner
‍
Research Reports
FREE
RESOUrCES
Simple Backtest
Calculator
Simple Seasonality
Calculator
The Kelly Criterion
Calculator
Sentiment Geo Map
‍
Public Research Reports
‍
Education
Sentiment Indicators
‍
Technical Indicators
‍
Pricing
Bundle pricing
‍
FAQ
‍
Announcements
‍
COMPANY
‍
About
‍
In the News
‍
Testimonials
‍
Client Success Stories
CONTACT
‍
General Inquiries
‍
Media Inquiries
‍
Financial Professionals Inquiries
‍
© 2026 Sundial Capital Research Inc. All rights reserved.
Setsail Marketing
TermsPrivacyAffiliate Program
Risk Disclosure: The information and tools provided are for research and analytical purposes only and are not intended as investment advice. Market analysis involves uncertainty, and outcomes may differ from expectations. Users should conduct their own due diligence and consider their individual circumstances before making any financial decisions. Past performance is not necessarily indicative of future results.

Hypothetical Performance Disclosure: Hypothetical performance results have many inherent limitations, some of which are described below. No representation is being made that any account will or is likely to achieve profits or losses similar to those shown; in fact, there are frequently sharp differences between hypothetical performance results and the actual results subsequently achieved by any particular trading program. One of the limitations of hypothetical performance results is that they are generally prepared with the benefit of hindsight. In addition, hypothetical trading does not involve financial risk, and no hypothetical trading record can completely account for the impact of financial risk of actual trading. for example, the ability to withstand losses or to adhere to a particular trading program in spite of trading losses are material points which can also adversely affect actual trading results. There are numerous other factors related to the markets in general or to the implementation of any specific trading program which cannot be fully accounted for in the preparation of hypothetical performance results and all which can adversely affect trading results.

Testimonial Disclosure: Testimonials appearing on this website may not be representative of other clients or customers and is not a guarantee of future performance or success.