Products
SentimenTrader Trading Tools
‍
Backtest Engine
My Trading Toolkit
Correlation Analysis
Seasonality
Market Prediction
Indicators & Data API
‍
Proprietary Indicators & Charts
Market Data API
Strategies & Scanner
‍
50+ Trading Strategies
Smart Stock Scanner
Smart Option Scanner
Research Reports
‍
Research Solutions
Reports Library
Free Resources
Simple Backtest Calculator
Simple Seasonality Calculator
The Kelly Criterion Calculator
Sentiment Geo Map
Public Research Reports
Education
Sentiment Indicators
Technical Indicators
Pricing
Company
About
In the News
Testimonials
Client Success Stories
Contact
Log inLoginSign up
< BACK TO ALL REPORTS

A short but compelling window for technology stocks

Jay Kaeppel
2022-10-27
The technology sector often trades in streaks or short-term bursts. One of the most favorable short-term periods of the year is about to begin.

Key points:

  • The technology sector has shown a long-term tendency to rally during certain times of the year
  • One of the more favorable short-term periods is about to begin
  • Traders can play this period using the XLK fund

A winning 7-day window for tech stocks

Tech stocks are entering a short-term supercharged seasonal window within a longer-term positive seasonal bias.

The chart below displays the annual seasonal trend for the Technology Select Sector SPDR Fund (XLK), an ETF that tracks the S&P 500 Technology Select Sector Index.

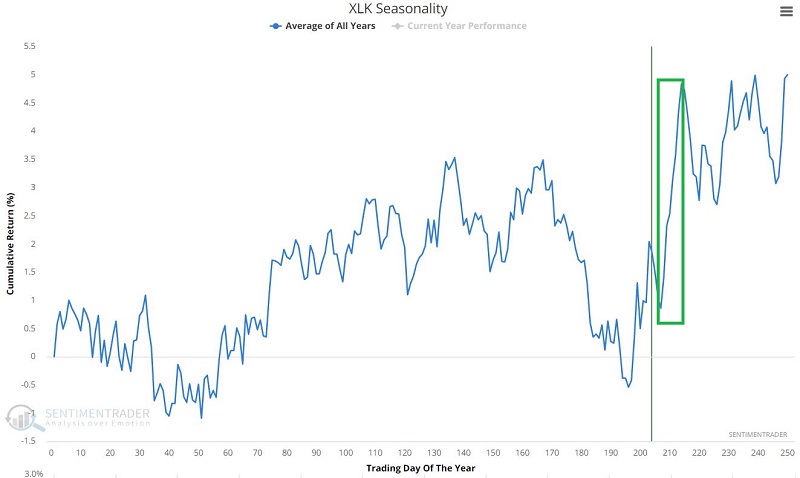
The period we will examine extends from the close on Trading Day of Year (TDY) #207 through the close on TDY #214, a total of seven trading days. For 2022, this period will extend from the close today, October 27, through November 7.

The chart below shows the cumulative percentage growth if invested in the technology sector every year during the seven days described above, starting in 1953. For testing purposes, we use the Fama French technology sector index through 1990 and the S&P 500 Information Technology Sector total return index after that.

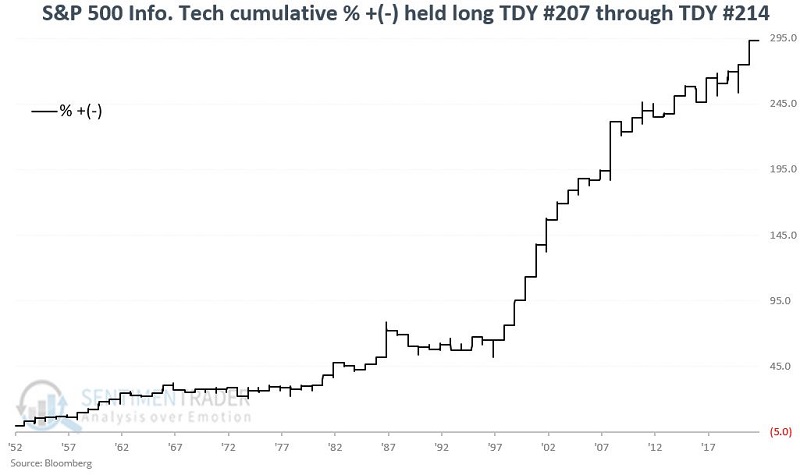
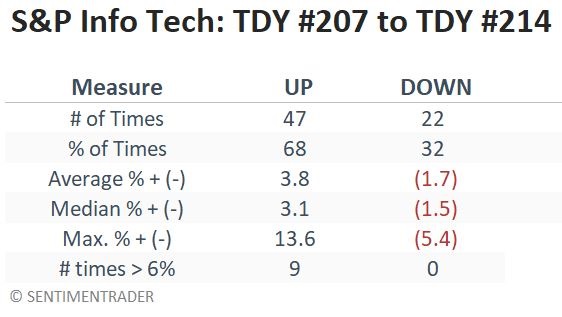
During these short windows, tech stocks rallied during 47 out of 69 years. But the most impressive thing is the size of the gains during positive years relative to losses during negative years. There was a very positive skew to the returns.

Real-world trading using an ETF

The purest trade for this tendency is the Technology Select Sector SPDR Fund (XLK). The chart below displays the cumulative percentage gain for XLK held only TDY #208 through TDY #214 each year since 1999.

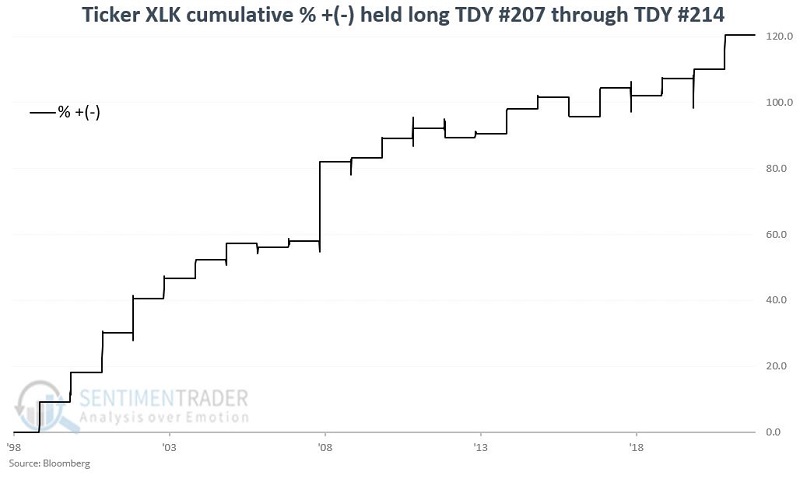
Since its inception, the fund rallied 19 out of 23 times and sported much larger gains during positive years than losses during the few negative ones.

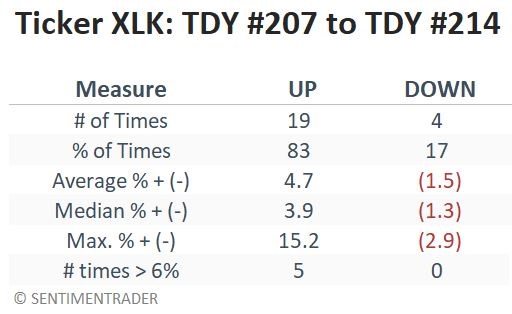
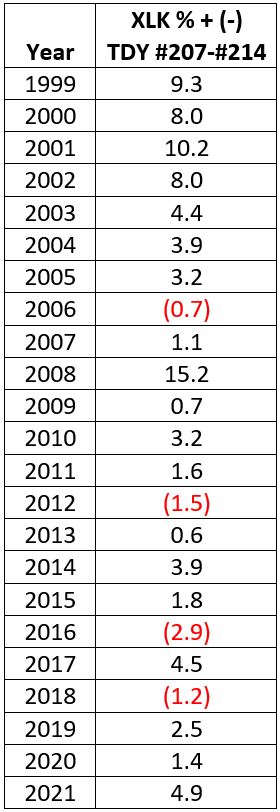
The table below displays XLK's year-by-year performance during the TDY #207 thru TDY #214 period. 

For anyone considering an options trade related to this tendency, the Invesco QQQ Trust (QQQ) is highly correlated to the technology sector. Options trading is much more liquid, with sharply higher volume and much tighter bid/ask spreads than XLK.

What the research tells us…

As we will discuss in a future article, the technology sector has a long historical tendency to be "streaky," i.e., to advance sharply in a short burst during particular times of the year.

The caveat with seasonality is that there is no guarantee that the latest time around will work out as hoped. Nevertheless, some short-term traders may find the historical results compelling.

PRODUCTS
SentimenTrader
Trading Tools
Indicators & Data API
‍
Strategies & Scanner
‍
Research Reports
FREE
RESOUrCES
Simple Backtest
Calculator
Simple Seasonality
Calculator
The Kelly Criterion
Calculator
Sentiment Geo Map
‍
Public Research Reports
‍
Education
Sentiment Indicators
‍
Technical Indicators
‍
Pricing
Bundle pricing
‍
FAQ
‍
Announcements
‍
COMPANY
‍
About
‍
In the News
‍
Testimonials
‍
Client Success Stories
CONTACT
‍
General Inquiries
‍
Media Inquiries
‍
Financial Professionals Inquiries
‍
© 2026 Sundial Capital Research Inc. All rights reserved.
Setsail Marketing
TermsPrivacyAffiliate Program
Risk Disclosure: The information and tools provided are for research and analytical purposes only and are not intended as investment advice. Market analysis involves uncertainty, and outcomes may differ from expectations. Users should conduct their own due diligence and consider their individual circumstances before making any financial decisions. Past performance is not necessarily indicative of future results.

Hypothetical Performance Disclosure: Hypothetical performance results have many inherent limitations, some of which are described below. No representation is being made that any account will or is likely to achieve profits or losses similar to those shown; in fact, there are frequently sharp differences between hypothetical performance results and the actual results subsequently achieved by any particular trading program. One of the limitations of hypothetical performance results is that they are generally prepared with the benefit of hindsight. In addition, hypothetical trading does not involve financial risk, and no hypothetical trading record can completely account for the impact of financial risk of actual trading. for example, the ability to withstand losses or to adhere to a particular trading program in spite of trading losses are material points which can also adversely affect actual trading results. There are numerous other factors related to the markets in general or to the implementation of any specific trading program which cannot be fully accounted for in the preparation of hypothetical performance results and all which can adversely affect trading results.

Testimonial Disclosure: Testimonials appearing on this website may not be representative of other clients or customers and is not a guarantee of future performance or success.