Products
SentimenTrader Trading Tools
‍
Backtest Engine
My Trading Toolkit
Correlation Analysis
Seasonality
Indicators & Data API
‍
Proprietary Indicators & Charts
Market Data API
Strategies & Scanner
‍
50+ Trading Strategies
Smart Stock Scanner
Research Reports
‍
Research Solutions
Reports Library
Free Resources
Simple Backtest Calculator
Simple Seasonality Calculator
The Kelly Criterion Calculator
Sentiment Geo Map
Public Research Reports
Education
Sentiment Indicators
Technical Indicators
Pricing
Company
About
In the News
Testimonials
Client Success Stories
Contact
Log inLoginSign up
< BACK TO ALL REPORTS

A Shocking Volatility Twist With Recovering Financials

Jason Goepfert
2019-05-01
null

Volatility twist

Over the past month, volatility in big tech stocks has been lower than volatility in stocks specifically chosen because of their staid nature, according to Bloomberg data. Historical volatility on the Nasdaq 100 fell below that of the S&P 500 Low Volatility Index, a rare twist over the past 28 years.

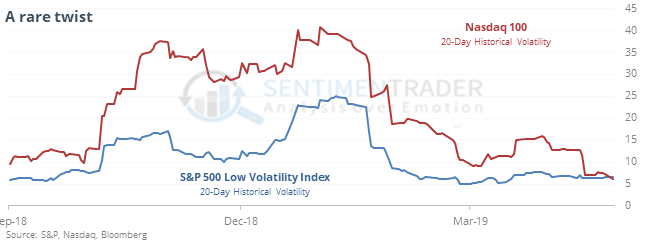
Surprisingly, these periods led to much (much!) better performance in the Nasdaq 100 than the Low Volatility Index. Two months later, the NDX rallied 92% of the time, versus only 38% of the time for Low Volatility.

Financial about-face

In late December, nearly 60% of financials fell to a 52-week low, a historic extreme. In January, they enjoyed a historic rebound and signs of impressive momentum. Now, more than 80% of them have recovered enough to trade above their 200-day averages.

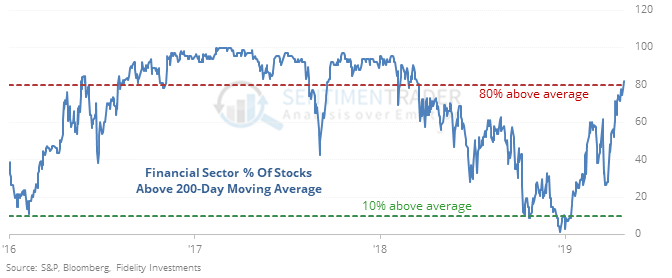
Other times the sector saw so many stocks sink so low then recover so quickly, it tended to keep rallying.

April showers bulls with good vibes

The S&P 500 ended April at a new multi-year high for the first time since 2013. It has happened 8 other years since 1928, leading to further gains through the first week of May all 8 times averaging 1.1%. The next couple of weeks were rougher, with 5 losses, and it was mixed after that.

This is also the first time since 2013 when each of the first four months were up at least 1%. All four added to gains through June, two showed losses through August, but through December all showed gains again.

No mo’ mo-mo?

The S&P hit new highs for 3 straight days, with a negative McClellan Oscillator each day. That triggered in October ’17, with no problem, but prior to that was an issue over the next 30 days.

This post was an abridged version of our previous day's Daily Report. For full access, sign up for a 30-day free trial now.

PRODUCTS
SentimenTrader
Trading Tools
Indicators & Data API
‍
Strategies & Scanner
‍
Research Reports
FREE
RESOUrCES
Simple Backtest
Calculator
Simple Seasonality
Calculator
The Kelly Criterion
Calculator
Sentiment Geo Map
‍
Public Research Reports
‍
Education
Sentiment Indicators
‍
Technical Indicators
‍
Pricing
Bundle pricing
‍
FAQ
‍
Announcements
‍
COMPANY
‍
About
‍
In the News
‍
Testimonials
‍
Client Success Stories
CONTACT
‍
General Inquiries
‍
Media Inquiries
‍
Financial Professionals Inquiries
‍
© 2025 Sundial Capital Research Inc. All rights reserved.
Setsail Marketing
TermsPrivacyAffiliate Program
Risk Disclosure: Futures and forex trading contains substantial risk and is not for every investor. An investor could potentially lose all or more than the initial investment. Risk capital is money that can be lost without jeopardizing ones’ financial security or life style. Only risk capital should be used for trading and only those with sufficient risk capital should consider trading. Past performance is not necessarily indicative of future results.

Hypothetical Performance Disclosure: Hypothetical performance results have many inherent limitations, some of which are described below. No representation is being made that any account will or is likely to achieve profits or losses similar to those shown; in fact, there are frequently sharp differences between hypothetical performance results and the actual results subsequently achieved by any particular trading program. One of the limitations of hypothetical performance results is that they are generally prepared with the benefit of hindsight. In addition, hypothetical trading does not involve financial risk, and no hypothetical trading record can completely account for the impact of financial risk of actual trading. for example, the ability to withstand losses or to adhere to a particular trading program in spite of trading losses are material points which can also adversely affect actual trading results. There are numerous other factors related to the markets in general or to the implementation of any specific trading program which cannot be fully accounted for in the preparation of hypothetical performance results and all which can adversely affect trading results.

Testimonial Disclosure: Testimonials appearing on this website may not be representative of other clients or customers and is not a guarantee of future performance or success.