
A sentiment survey suggests higher stock prices

Key points:
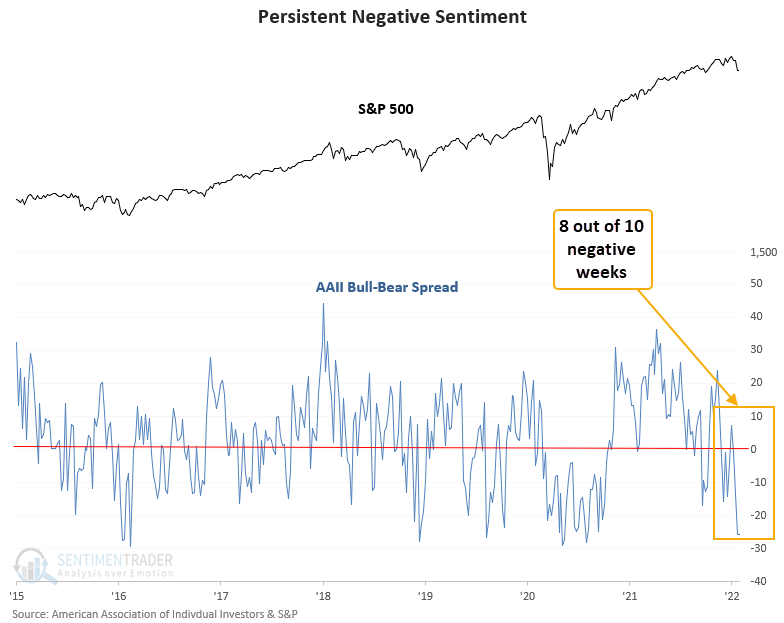
- The American Association of Individual Investors sentiment survey shows persistent pessimism
- Bears have been higher than bulls been for 8 out of 10 weeks
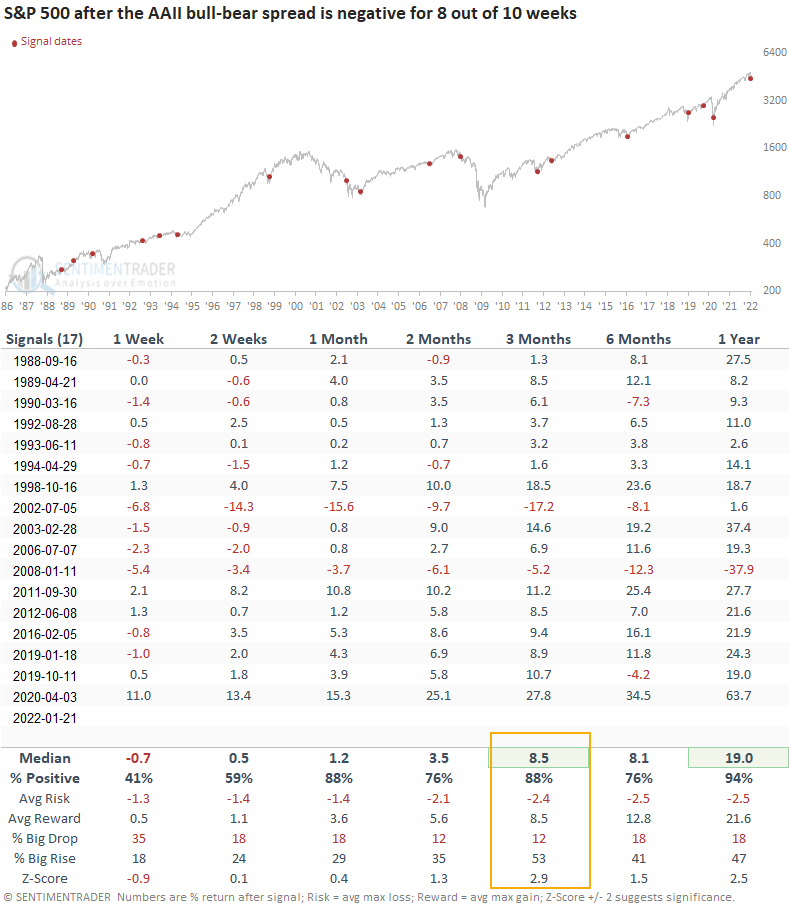
- The S&P 500 has rallied 88% of the time 3 months later after other signals
The AAII bull-bear spread as a contrary sentiment indicator
The AAII sentiment survey can be used as a contrary indicator to identify an environment where sentiment has become too pessimistic on the future direction of stocks. When opinions become too bearish, stocks tend to rally.
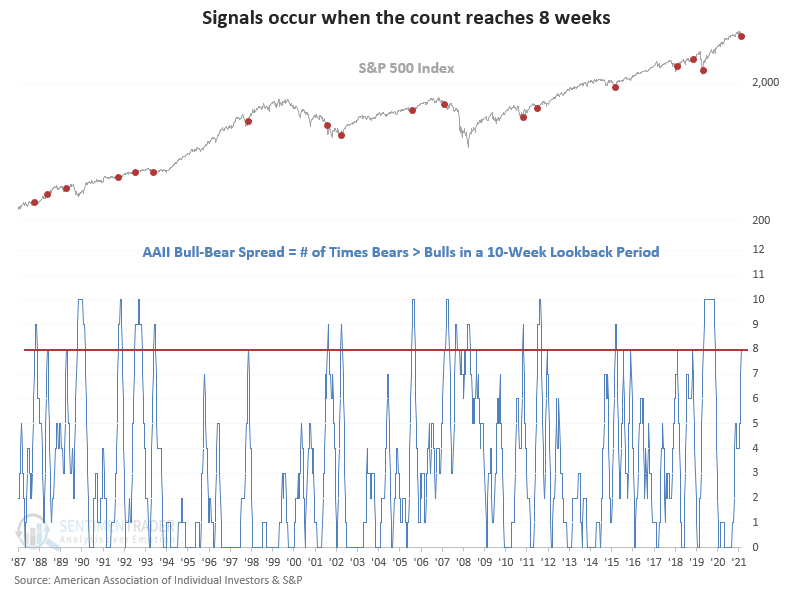
A trading model that identifies bearish sentiment
The bull-bear spread trading model identifies when bears have been greater than bulls for 8 out of 10 weeks. The lookback count indicator must reset below 2 weeks for a new signal to trigger, and I do not use an index momentum condition with this signal.
Similar periods of pessimism have preceded gains 88% of the time
This signal has triggered 17 other times over the past 34 years. After the others, S&P 500 future returns and win rates were solid across almost all time frames, especially the 3-month window. A year later, stocks were higher 94% of the time.
What the research tells us...
When the spread between bulls and bears for the AAII sentiment survey shows more bears than bulls for 8 out of 10 weeks, traders have become too pessimistic on the outlook for stocks. Similar setups to what we're seeing now have preceded rising prices for the S&P 500, with a 3-month win rate of 88%. The 1-week time frame suggests stocks are susceptible to some short-term volatility.